Residential real estate investors and investment properties in 2020

Residential real estate investors and investment properties in 2020

Overview

For the first time, the Canadian Housing Statistics Program (CHSP) is publishing data on investors. This article presents a profile of these owners and the residential properties they owned in the provinces of Nova Scotia, New Brunswick, Ontario, Manitoba and British Columbia in 2020.

Key findings

  • The proportion of investors among owners varied from 20.2{d4d1dfc03659490934346f23c59135b993ced5bc8cc26281e129c43fe68630c9} in Ontario to 31.5{d4d1dfc03659490934346f23c59135b993ced5bc8cc26281e129c43fe68630c9} in Nova Scotia.
  • Among houses and condominium apartments, just under one in five properties was used as an investment in British Columbia, Manitoba, Ontario, New Brunswick and Nova Scotia combined.
  • Condominium apartments were used as an investment more often than houses (single-detached houses, semi-detached houses, row houses, and mobile homes). Ontario topped the list with the highest rate of condominium apartments used as an investment, at 41.9{d4d1dfc03659490934346f23c59135b993ced5bc8cc26281e129c43fe68630c9}.
  • Houses used as an investment were mainly owned by individuals living in the same province as the property.

Introduction

Residential properties can be owned for several reasons: for use as a primary place of residence, but also for occasional use as a secondary residence, to generate income or other investment purposes. When properties are owned by investors, they can contribute to the rental housing supply—and therefore meet the population’s need for rental housing—but that can also limit the number of properties available to buyers who intend to use it as a primary place of residence. Data from the 2021 Census showed that the proportion of Canadian households who owned their home fell from 69.0{d4d1dfc03659490934346f23c59135b993ced5bc8cc26281e129c43fe68630c9} in 2011 to 66.5{d4d1dfc03659490934346f23c59135b993ced5bc8cc26281e129c43fe68630c9} in 2021. This article distinguishes between investors and other types of owners to better understand the profile of investors, what they own, and the role they play in the market.

This topic is especially important since, in the United States, the study by Haughwout et al. (2011) showed an increase in the proportion of investors among buyers from 2000 to 2007, when a housing bubble emerged. These borrowers then contributed considerably to the rise in delinquency rates during the 2007/2008 housing crisis. Analyzing the subsequent period in the United States (2009 to 2013), the study by Allen et al. (2018) also found that an increase in the percentage of houses purchased by investors in a given area led to higher prices in that market.

North of the border, the Bank of Canada (2022) analyzed the importance of investors—defined as buyers who own multiple mortgaged properties—and found an increase in the proportion of purchases by investors in Canada in the first half of 2021. Teranet (2022) made a similar observation in an analysis of transactions carried out by owners of multiple properties in Ontario. The Canada Mortgage and Housing Corporation (2016) also investigated investors — defined as households who own a primary residence and at least one secondary condominium unit — using a survey of condominium owner households in Toronto and Vancouver. They found that 48.4{d4d1dfc03659490934346f23c59135b993ced5bc8cc26281e129c43fe68630c9} of investors in 2015 stated that their secondary unit was rented out while 42.0{d4d1dfc03659490934346f23c59135b993ced5bc8cc26281e129c43fe68630c9} stated that they or a family member were using the unit.

In this release, the CHSP follows a different approach by identifying properties owned by investors among the entire stock of residential properties in Nova Scotia, New Brunswick, Ontario, Manitoba and British Columbia for the reference year 2020.Note The findings provide a snapshot of the situation in these provinces before the COVID-19 pandemic and can therefore be used as a point of comparison to determine the effects of the public health crisis when examining subsequent years.

What is an investor?

In this analysis, owners are divided into three categories: investors, investor-occupants, and non-investors.

An investor is defined as an owner who owns at least one residential property that is not used as their primary place of residence. Individual owners who own a single property in the same province as where they reside are not considered investors, so long as it is not a property with multiple units.

Specifically, the following owners are considered to be investors:

  • A business or government that owns at least one residential property, excluding Canadian non-profit organizations.Note Given the predominance of businesses in this category, they will simply be referred to as “business” in what follows.
  • An individual owner who is not resident in Canada, referred to as a “non-resident investor” below.
  • An individual owner who lives outside the province where they own residential property, referred to as an “out-of-province investor” in the province of the non-principal residence.
  • An individual owner who lives in the province and owns two or more residential properties, or owns a property with multiple residential units who does not occupy that property. These individuals will be referred to as “in-province investors”.

The investor category thus can include, among others, secondary residence owners, landlords, short-term rental owners, developers, for-profit businesses and speculators.

An owner is classified as an investor-occupant if they own a single property with multiple residential units, one of which is their primary place of residence. For example, this category includes owners of a house with a laneway unit or basement suite and owners of a duplex who live in one of the units. In all cases, at least one of the units must be occupied by one of the owners.

An owner is classified as a non-investor when they are not an investor or an investor-occupant. This category primarily includes owners who live in the province where the property is located, who own a single property, and this property does not have multiple residential units. Canadian non-profit businesses are also included in this category.Note

More than one in five owners is an investor

For British Columbia, Manitoba, Ontario, New Brunswick and Nova Scotia combined, CHSP data show that a total of 21.9{d4d1dfc03659490934346f23c59135b993ced5bc8cc26281e129c43fe68630c9} of owners were investors in 2020. The proportion of investors was higher in Nova Scotia (31.5{d4d1dfc03659490934346f23c59135b993ced5bc8cc26281e129c43fe68630c9}) and New Brunswick (29.0{d4d1dfc03659490934346f23c59135b993ced5bc8cc26281e129c43fe68630c9}) than in British Columbia (23.3{d4d1dfc03659490934346f23c59135b993ced5bc8cc26281e129c43fe68630c9}), Manitoba (20.4{d4d1dfc03659490934346f23c59135b993ced5bc8cc26281e129c43fe68630c9}), and Ontario (20.2{d4d1dfc03659490934346f23c59135b993ced5bc8cc26281e129c43fe68630c9}).
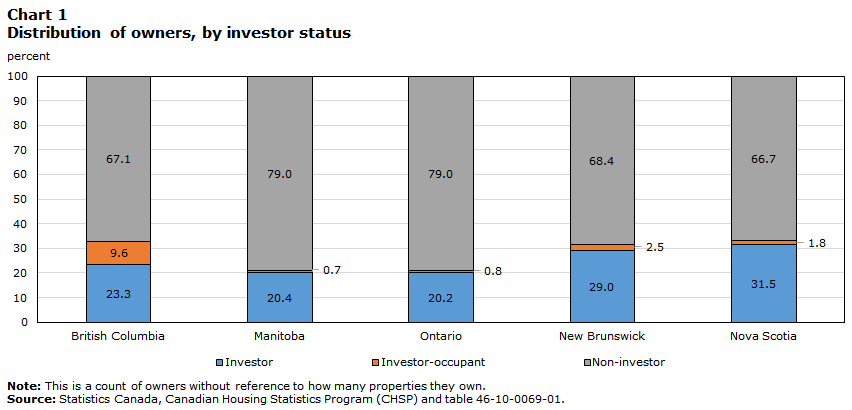
Residential real estate investors and investment properties in 2020

Data table for Chart 1


Data table for chart 1

Table summary

This table displays the results of Data table for chart 1 British Columbia, Manitoba, Ontario, New Brunswick and Nova Scotia, calculated using percent units of measure (appearing as column headers).

British Columbia Manitoba Ontario New Brunswick Nova Scotia
percent
Investor 23.3 20.4 20.2 29.0 31.5
Investor-occupant 9.6 0.7 0.8 2.5 1.8
Non-investor 67.1 79.0 79.0 68.4 66.7


This difference is largely due to a higher proportion of vacant land in the two Atlantic provinces, which is a type of property often owned in addition to the primary place of residence. The proportion of investors who live in the province and own one or two pieces of vacant land in addition to their primary place of residence was 6.7{d4d1dfc03659490934346f23c59135b993ced5bc8cc26281e129c43fe68630c9} in Nova Scotia and 7.7{d4d1dfc03659490934346f23c59135b993ced5bc8cc26281e129c43fe68630c9} in New Brunswick. If we remove this type of investor, the rate of investors falls to 24.8{d4d1dfc03659490934346f23c59135b993ced5bc8cc26281e129c43fe68630c9} in Nova Scotia and 21.3{d4d1dfc03659490934346f23c59135b993ced5bc8cc26281e129c43fe68630c9} in New Brunswick. The proportions of investors are then more comparable to those of the other provinces.

Given that the stock of vacant land is proportionally lower and more expensive in British Columbia and Ontario, less than 2{d4d1dfc03659490934346f23c59135b993ced5bc8cc26281e129c43fe68630c9} of owners in these provinces were in-province investors who owned one or two pieces of vacant land in addition to their primary place of residence. In Manitoba, the proportion of homeowners in this situation was also low, at 2.5{d4d1dfc03659490934346f23c59135b993ced5bc8cc26281e129c43fe68630c9}.

Investor-occupants are more common in British Columbia, where they made up 9.6{d4d1dfc03659490934346f23c59135b993ced5bc8cc26281e129c43fe68630c9} of owners. This higher proportion is mostly due to the composition of the housing stock. In this province, properties with multiple residential units represented 11.7{d4d1dfc03659490934346f23c59135b993ced5bc8cc26281e129c43fe68630c9} of the stock, a higher proportion than in the other provinces, where it varied from 2.9{d4d1dfc03659490934346f23c59135b993ced5bc8cc26281e129c43fe68630c9} in Ontario to 5.7{d4d1dfc03659490934346f23c59135b993ced5bc8cc26281e129c43fe68630c9} in Nova Scotia. This higher percentage in British Columbia was mostly attributable to many residences with a laneway unit or a basement suite among properties with multiple residential units. These kinds of properties were more likely to be occupied by the owner when compared to apartment buildings in British Columbia and elsewhere.

How is the investment status of the property defined?

An analysis of properties used as an investment helps clarify the role that investors play in the housing market. The investment status of the property is determined by analyzing the investor status of the owner and the use of the property. Properties are divided into one of the following three categories: an investment property, an owner-occupied investment property, and a non-investment property.Note

An investment property is defined as a property owned by at least one investor that is not the primary place of residence of any of the owners. This can include, for example, a rented property with one or more units, a cottage or a property owned for speculative purposes.

If the property is not included in the previous category, it can be considered an owner-occupied investment property if it is a property with multiple residential units where at least one of the owners occupies a unit.Note

Finally, the non-investment property category includes properties owned only by non-investors or those used as a primary place of residence by at least one of the owners.

The proportion of investment properties varies greatly by the type of property analyzed. Vacant land and properties with multiple residential units are used more for investment than single-detached houses, semi-detached houses, row houses, and mobile homes — which we refer to as “houses” in this article — and condominium apartments.

In all the provinces analyzed in this study combined, more than 9 in 10 vacant lots were investment properties or were owned by a non-profit organization. The remainder were owned by individuals residing in the province where they owned a single vacant lot. Similarly, for all these provinces, 96.7{d4d1dfc03659490934346f23c59135b993ced5bc8cc26281e129c43fe68630c9} of properties with multiple residential units were either investment properties (45.6{d4d1dfc03659490934346f23c59135b993ced5bc8cc26281e129c43fe68630c9}) or owner-occupied investment properties (51.1{d4d1dfc03659490934346f23c59135b993ced5bc8cc26281e129c43fe68630c9}), while the rest were owned by non-profit organizations. However, these proportions varied from one province to another. In British Columbia, 73.0{d4d1dfc03659490934346f23c59135b993ced5bc8cc26281e129c43fe68630c9} of properties with multiple dwellings were owner-occupied investment properties. By contrast, in the other provinces, the majority of properties with multiple dwellings were investment properties, with the proportion reaching 72.0{d4d1dfc03659490934346f23c59135b993ced5bc8cc26281e129c43fe68630c9} in Manitoba.

As a result, provinces with a large stock of vacant land, such as New Brunswick and Nova Scotia, and those with a high proportion of properties with multiple residential units, such as British Columbia, had high rates of investors or investor-occupants. The portrait shifts when the focus is on houses and condominium apartments, which are more likely to be owner-occupied, and therefore not used for investment purposes. In the following sections, the analysis of properties focuses exclusively on houses and condominium apartments, and excludes properties with multiple dwellings and vacant land.

In Nova Scotia, more than 1 in 20 houses is used as an investment by a person living outside the province or the country

The analysis by property type found that investors were drawn more to condominium apartments than houses. The share of houses used as an investment varied from 14.3{d4d1dfc03659490934346f23c59135b993ced5bc8cc26281e129c43fe68630c9} in New Brunswick to 20.1{d4d1dfc03659490934346f23c59135b993ced5bc8cc26281e129c43fe68630c9} in Nova Scotia, with an overall average of 15.6{d4d1dfc03659490934346f23c59135b993ced5bc8cc26281e129c43fe68630c9} for all five provinces. By comparison, this same statistic for condominium apartments was 39.4{d4d1dfc03659490934346f23c59135b993ced5bc8cc26281e129c43fe68630c9}. For the five provinces, a total of 918,695 houses were used as an investment, 584,615 of which were in Ontario. A regional analysis found that the proportion of houses used as an investment was generally higher in more touristic regions, where there may be more cottages.

In-province investors owned, as investment properties, between 8.7{d4d1dfc03659490934346f23c59135b993ced5bc8cc26281e129c43fe68630c9} of the houses in New Brunswick and 12.4{d4d1dfc03659490934346f23c59135b993ced5bc8cc26281e129c43fe68630c9} in Nova Scotia, and, as such, they owned more houses used as an investment than all the other types of investors combined.
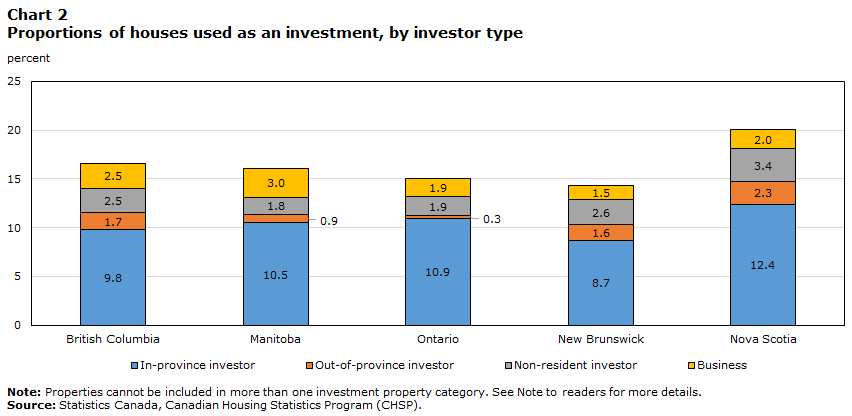
Chart 2: Proportions of houses used as an investment, by investor type

Data table for Chart 2


Data table for chart 2

Table summary

This table displays the results of Data table for chart 2 British Columbia, Manitoba, Ontario, New Brunswick and Nova Scotia, calculated using percent units of measure (appearing as column headers).

British Columbia Manitoba Ontario New Brunswick Nova Scotia
percent
In-province investor 9.8 10.5 10.9 8.7 12.4
Out-of-province investor 1.7 0.9 0.3 1.6 2.3
Non-resident investor 2.5 1.8 1.9 2.6 3.4
Business 2.5 3.0 1.9 1.5 2.0


Out-of-province investors owned proportionally fewer houses used as an investment in Ontario (0.3{d4d1dfc03659490934346f23c59135b993ced5bc8cc26281e129c43fe68630c9}) than out-of-province investors in the other provinces, which is likely partly due to higher real estate prices in Ontario than most of the provinces. Nova Scotia, New Brunswick and British Columbia seemed more popular with out-of-province investors, who owned, as investments, 2.3{d4d1dfc03659490934346f23c59135b993ced5bc8cc26281e129c43fe68630c9}, 1.6{d4d1dfc03659490934346f23c59135b993ced5bc8cc26281e129c43fe68630c9} and 1.7{d4d1dfc03659490934346f23c59135b993ced5bc8cc26281e129c43fe68630c9} of houses, respectively. New Brunswick and Nova Scotia may have attracted residents from other provinces with lower average housing prices than in other provinces. As for British Columbia, the number of out-of-province investors was particularly high in the areas near the Alberta border. In British Columbia, non-residents and out-of-province investors owned 43,890 houses used as an investment.

Condominium apartments are more popular with investors than houses

The share of condominium apartments used as an investment was higher than for houses, varying from 22.6{d4d1dfc03659490934346f23c59135b993ced5bc8cc26281e129c43fe68630c9} in New Brunswick to 41.9{d4d1dfc03659490934346f23c59135b993ced5bc8cc26281e129c43fe68630c9} in Ontario and totalling 39.4{d4d1dfc03659490934346f23c59135b993ced5bc8cc26281e129c43fe68630c9} for all five provinces. Although this share was higher in Ontario and British Columbia (36.2{d4d1dfc03659490934346f23c59135b993ced5bc8cc26281e129c43fe68630c9}) than in Manitoba (29.2{d4d1dfc03659490934346f23c59135b993ced5bc8cc26281e129c43fe68630c9}) and New Brunswick, this does not appear to be attributable to the large census metropolitan areas (CMAs) in those provinces. In fact, the rate of condominium apartments used as investment was lower in the CMAs of Toronto (36.2{d4d1dfc03659490934346f23c59135b993ced5bc8cc26281e129c43fe68630c9}) and Vancouver (34.0{d4d1dfc03659490934346f23c59135b993ced5bc8cc26281e129c43fe68630c9}) than the rate in the rest of their respective provinces.
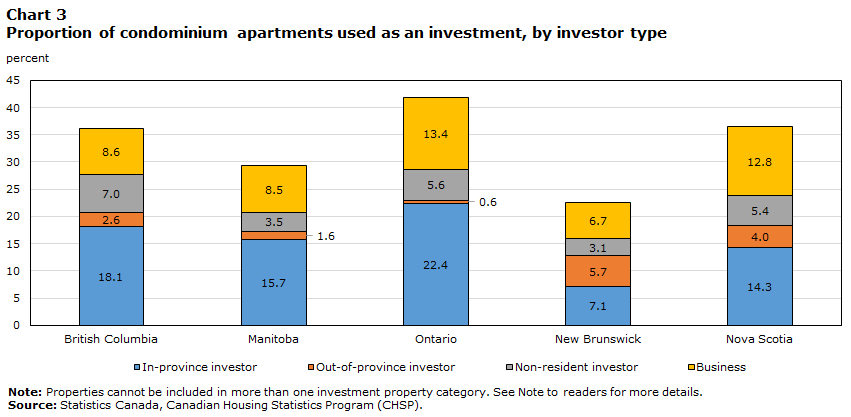
Chart 1: Proportion of condominium apartments used as an investment, by investor type

Data table for Chart 3


Data table for chart 3

Table summary

This table displays the results of Data table for chart 3 British Columbia, Manitoba, Ontario, New Brunswick and Nova Scotia, calculated using percent units of measure (appearing as column headers).

British Columbia Manitoba Ontario New Brunswick Nova Scotia
percent
In-province investor 18.1 15.7 22.4 7.1 14.3
Out-of-province investor 2.6 1.6 0.6 5.7 4.0
Non-resident investor 7.0 3.5 5.6 3.1 5.4
Business 8.6 8.5 13.4 6.7 12.8


There was a higher rate of business-owned investment properties among the condominium apartment stock than in the stock of houses. In Ontario, businesses owned 74,485 condominium apartments for investment purposes, or 13.4{d4d1dfc03659490934346f23c59135b993ced5bc8cc26281e129c43fe68630c9} of all properties of this type, which is the highest share among the provinces analyzed. Nevertheless, most condominium apartments used as an investment in both Ontario and Manitoba were owned by in-province investors. In the other jurisdictions, this was not the case.

The proportion of condominium apartments owned for investment purposes by non-resident investors was the highest in British Columbia (7.0{d4d1dfc03659490934346f23c59135b993ced5bc8cc26281e129c43fe68630c9}), followed by Ontario (5.6{d4d1dfc03659490934346f23c59135b993ced5bc8cc26281e129c43fe68630c9}).

More investment properties outside CMAs and census agglomerations (CAs) seem to be used as a secondary residence

While some investors rent out their investment property, others may use it as a secondary residence. Properties located outside CMAs and CAs are more likely to be used as secondary or recreational properties, such as cottages, when the owners are residents of the province and only own one additional property outside the region of their primary residence.Note These properties may or may not be rented.

Outside the major centres, this type of investment made up between 3.2{d4d1dfc03659490934346f23c59135b993ced5bc8cc26281e129c43fe68630c9} of houses and condominium apartments in New Brunswick and 11.1{d4d1dfc03659490934346f23c59135b993ced5bc8cc26281e129c43fe68630c9} in Ontario. In the latter, this amounted to 70,610 properties, or 1.6{d4d1dfc03659490934346f23c59135b993ced5bc8cc26281e129c43fe68630c9} of all houses and condominium apartments in the province. Of these, more than 99{d4d1dfc03659490934346f23c59135b993ced5bc8cc26281e129c43fe68630c9} were houses, while condominium apartments, which are less common outside major centres, represented less than 1{d4d1dfc03659490934346f23c59135b993ced5bc8cc26281e129c43fe68630c9} of the investment properties of this type.

In British Columbia and, to a lesser extent, Nova Scotia, the share of potential secondary residences owned by out-of-province investors was higher than in the other jurisdictions. In British Columbia, investment properties owned by out-of-province residents represented 6.3{d4d1dfc03659490934346f23c59135b993ced5bc8cc26281e129c43fe68630c9} of the houses and condominium apartments outside CMAs and CAs, while the figure for Nova Scotia was 3.5{d4d1dfc03659490934346f23c59135b993ced5bc8cc26281e129c43fe68630c9}.
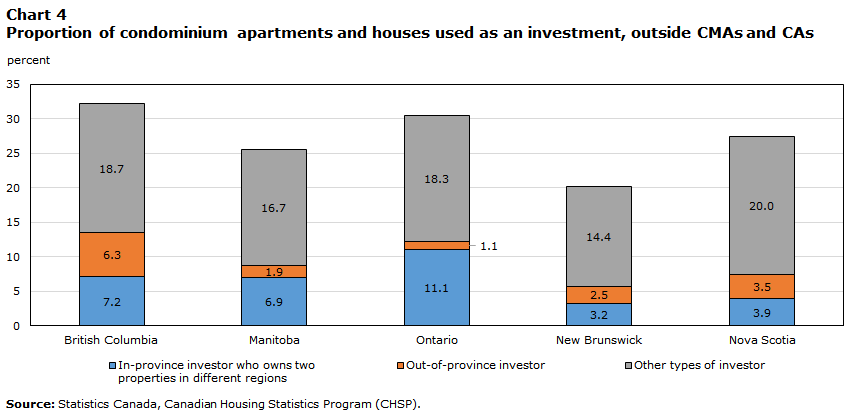
Chart 4: Proportion of investment properties outside CMAs and CAs among condominium apartments and houses

Data table for Chart 4


Data table for chart 4

Table summary

This table displays the results of Data table for chart 4 British Columbia, Manitoba, Ontario, New Brunswick and Nova Scotia, calculated using percent units of measure (appearing as column headers).

British Columbia Manitoba Ontario New Brunswick Nova Scotia
percent
In-province investor who owns two properties in different regions 7.2 6.9 11.1 3.2 3.9
Out-of-province investor 6.3 1.9 1.1 2.5 3.5
Other types of investor 18.7 16.7 18.3 14.4 20.0


Although a secondary residence could also be a pied-à-terre in the city, this seemed less common. In large urban centres, the proportion of houses and condominium apartments used as an investment owned by residents from outside the region or the province was lower than in areas outside CMAs or CAs. This proportion was highest in the CAs and CMAs in Nova Scotia (2.2{d4d1dfc03659490934346f23c59135b993ced5bc8cc26281e129c43fe68630c9}) and British Columbia (2.2{d4d1dfc03659490934346f23c59135b993ced5bc8cc26281e129c43fe68630c9}). In CMAs and CAs of the five provinces, the second property of in-province investors living in a different region was more often a condominium (23.0{d4d1dfc03659490934346f23c59135b993ced5bc8cc26281e129c43fe68630c9} of cases) than was the case outside major centres.
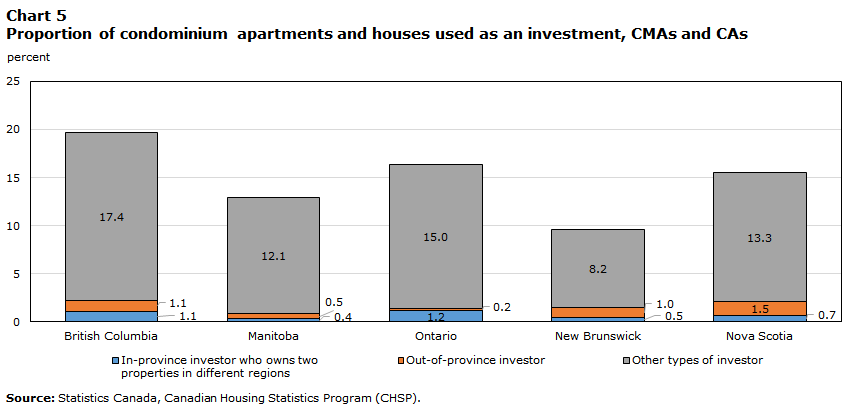
Chart 5: Proportion of investment properties among condominium apartments and houses, CMAs and CAs

Data table for Chart 5


Data table for chart 5

Table summary

This table displays the results of Data table for chart 5 British Columbia, Manitoba, Ontario, New Brunswick and Nova Scotia, calculated using percent units of measure (appearing as column headers).

British Columbia Manitoba Ontario New Brunswick Nova Scotia
percent
In-province investor who owns two properties in different regions 1.1 0.4 1.2 0.5 0.7
Out-of-province investor 1.1 0.5 0.2 1.0 1.5
Other types of investor 17.4 12.1 15.0 8.2 13.3


In the Toronto and Vancouver CMAs, investment properties were concentrated in the downtown core

In both Toronto and Vancouver CMAs, there was a higher proportion of investment properties in the core census subdivisions (CSDs). In the Vancouver CMA, the Greater Vancouver ANote CSD was the one exception, with a higher proportion of houses and condominium apartments used as an investment (42.1{d4d1dfc03659490934346f23c59135b993ced5bc8cc26281e129c43fe68630c9}) than in the other CSDs in the region. This is consistent with other trends observed for Greater Vancouver A. According to the 2021 Census, this CSD had a higher proportion of renters (57.3{d4d1dfc03659490934346f23c59135b993ced5bc8cc26281e129c43fe68630c9} of households) than in the rest of the CMA. This difference is partially due to the students who attend the University of British Columbia, which is located in this area. Students are more likely to be renters, but they could also be owners, or they could live in a second property owned by a family member. In addition, this CSD had the highest non-resident ownership rate (14.9{d4d1dfc03659490934346f23c59135b993ced5bc8cc26281e129c43fe68630c9}) in the CMA in 2020.

In the City of Vancouver, which is the core CSD, the proportion of houses and condominium apartments used as an investment was 32.5{d4d1dfc03659490934346f23c59135b993ced5bc8cc26281e129c43fe68630c9}, the second highest proportion in the Vancouver CMA, which had an overall rate of 21.3{d4d1dfc03659490934346f23c59135b993ced5bc8cc26281e129c43fe68630c9}. The higher share of investment properties in the core CSD is partly due to a greater concentration of condominium apartments, which are more often used as an investment. However, even considering condominium apartments and single detached houses separately, both had a higher rate of properties used as an investment in the Vancouver CSD than in the rest of the CMA.
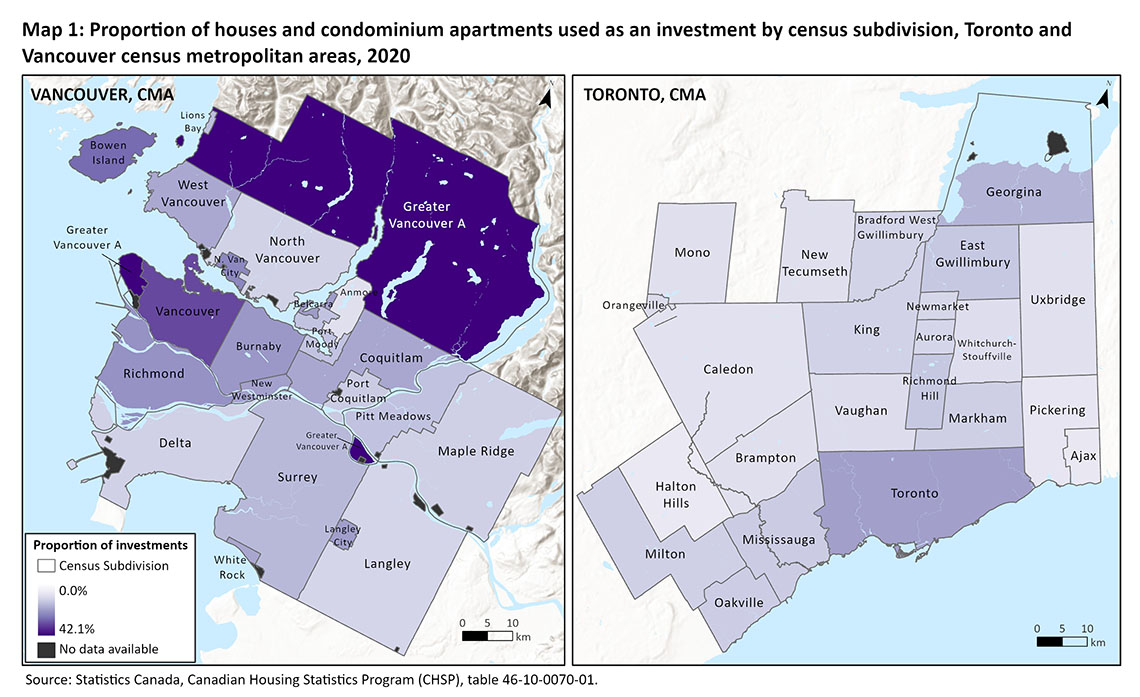
Map 1: Proportion of houses and condominium apartments used as an investment by census subdivision. Toronto and Vancouver census metropolitan areas, 2020

Description for Map 1


The title of the map is: “Proportion of houses and condominium apartments used as an investment by census subdivision, Toronto and Vancouver census metropolitan areas, 2020.” This figure displays two maps of the CSDs in the Vancouver CMA (left side) and the Toronto CMA (right side). 


Each CSD is shaded from light to dark purple based on the proportion of houses and condominium apartments used as an investment. The darker the shade, the higher the proportion of houses and condominium apartments used as an investment in that CSD. The map shows that the proportion of houses and condominium apartments used as an investment is generally higher in CSDs near the core of the Vancouver and Toronto CMAs. A continuous scale is used and ranges from 0.0{d4d1dfc03659490934346f23c59135b993ced5bc8cc26281e129c43fe68630c9} to 42.1{d4d1dfc03659490934346f23c59135b993ced5bc8cc26281e129c43fe68630c9}.


Proportion of houses and condominium apartments used as an investment by census subdivision, Toronto and Vancouver census metropolitan areas, 2020

Table summary

This table displays the results of Proportion of houses and condominium apartments used as an investment by census subdivision. The information is grouped by Census subdivision name (appearing as row headers), Proportion of houses and condominium apartments used as an investment (percent) (appearing as column headers).
Census subdivision name Proportion of houses and condominium apartments used as an investment (percent)
Toronto CMA
Ajax, Town 7.4
Aurora, Town 12.1
Bradford West Gwillimbury, Town 12.6
Brampton, City 9.8
Caledon, Town 9.2
East Gwillimbury, Town 15.1
Georgina, Town 18.4
Halton Hills, Town 7.1
King, Township 12.9
Markham, City 13.7
Milton, Town 13.2
Mississauga, City 14.2
Mono, Town 9.6
New Tecumseth, Town 9.8
Newmarket, Town 12.1
Oakville, Town 13.9
Orangeville, Town 11.5
Pickering, City 8.0
Richmond Hill, Town 15.0
Toronto, City 21.7
Uxbridge, Township 9.5
Vaughan, City 10.6
Whitchurch-Stouffville, Town 10.2
Vancouver
Anmore, Village 9.2
Belcarra, Village 20.9
Bowen Island, Island municipality 28.3
Burnaby, City 21.6
Coquitlam, City 19.1
Delta, District municipality 12.1
Greater Vancouver A, Regional district electoral area 42.1
Langley, City 20.6
Langley, District municipality 11.4
Lions Bay, Village 16.0
Maple Ridge, City 12.3
New Westminster, City 20.2
North Vancouver, City 24.3
North Vancouver, District municipality 11.8
Pitt Meadows, City 14.8
Port Coquitlam, City 13.3
Port Moody, City 14.8
Richmond, City 22.4
Surrey, City 16.5
Vancouver, City 32.5
West Vancouver, District municipality 19.0
White Rock, City 19.2


The finding was similar in Toronto, where the proportion of investment properties was higher in the core CSD of the City of Toronto (21.7{d4d1dfc03659490934346f23c59135b993ced5bc8cc26281e129c43fe68630c9}) than in the CMA as a whole (16.3{d4d1dfc03659490934346f23c59135b993ced5bc8cc26281e129c43fe68630c9}). For the CSD, this amounts to 112,220 condominium apartments and 52,935 houses used as an investment.

Note to readers

The Canadian Housing Statistics Program (CHSP) is an innovative data project that leverages existing data sources and transforms them into new and timely indicators on Canadian housing.

The data in this study are compiled from the CHSP for the reference year 2020. Complete information about the reference years of the property stock, by province and territory, are available here.

Methodology

Investor status and investment status of the residential property take into consideration the type of property as obtained by our data providers. Certain properties may have secondary units that are not known to the authorities. As a result, we cannot account for them. The counts and distribution of properties are calculated based on the property classifications established by the CHSP. These may differ from the ones used by local authorities.

Once the property is categorized as an investment property, a subcategory is created to determine the type of investment property. This is based on the type of investor who owns it. The order of priority is as follows:

  1. Investment property owned by at least one business or one government;
  2. Investment property owned by at least one non-resident individual;
  3. Investment property owned by at least one out-of-province individual;
  4. Investment property owned by an individual living in the province.

Properties cannot be included in more than one investment property category. If the property has multiple owners with various profiles, once an owner fits in one of the categories, by order of priority, then the property is included in that category.

Geographical boundaries

In CHSP releases, data are based on the geographical boundaries from the Standard Geographical Classification 2016.

The CHSP database does not contain information about residential properties on Indian reserves.

Definitions

A property owner refers to an individual or an entity included in the classification of ‘business and government’ (such as corporations, governments, sole proprietorships and partnerships, and other legal types) that has property title transferred to, recorded in, registered in, or otherwise carried in their name.

A property may have more than one owner or an owner may have more than one property, therefore the count of owners and properties can differ.

An individual is considered a non-resident if their primary dwelling is outside the economic territory of Canada.

The core of a geographic area, for the purposes of this release, refers to the census subdivision (CSD) within a census metropolitan area (CMA) with the highest number of residential properties.

An investor is defined as an owner who owns at least one residential property that is not used as their primary place of residence, excluding Canadian non-profit organizations. An individual owner who owns a single property in the same province as where they reside is not considered an investor, so long as it is not a property with multiple residential units. This category excludes investor-occupants.

An investor-occupant is defined as an owner who possesses a single property with multiple residential units and who occupies that property.

A non-investor is defined as an owner who is not an investor or an investor-occupant. An owner who lives in the same province as where the property is owned and owns a single property is included in this category, so long as it is not a property with multiple residential units.

An investment property refers to a residential property owned by at least one investor and is not used as a primary place of residence by any of the owners. This category excludes owner-occupied investment properties.

An owner-occupied investment property refers to a property with multiple residential units where at least one of the owners occupies a unit.

A non-investment property refers to a property held solely by non-investors or a property being used as a primary place of residence by at least one of the owners and that is not an owner-occupied investment property.

The term unspecified investment property status refers to properties whose owner is unknown, and therefore the investment status of the property cannot be determined.

A property with multiple residential units refers to a property containing more than one set of living quarters owned by the same owner(s), as is the case for an apartment building or a duplex or a property with two houses on the same lot.

A condominium apartment refers to a set of living quarters that is owned individually, while land and common elements are held in joint ownership with others.

Bibliography

Allen, Marcus T., Rutherford, J., Rutherford, R., Yavas, A. (2018). Impact of Investors in Distressed Housing Markets. The Journal of Real Estate Finance and Economics. 56. 622-652.

Canada Mortgage and Housing Corporation (2016). “Condominium owners report – Toronto and Vancouver”. April 2016. https://publications.gc.ca/collections/collection_2016/schl-cmhc/NH21-3-2016-eng.pdf

Haughwout, A., D. Lee, J. Tracy, and van der Klaauw, W. (2011). Real estate investors, the leverage cycle, and the housing market crisis. Staff Reports 514, Federal Reserve Bank of New York.

Khan, M., Xu, Y. (2022). Housing demand in Canada: A novel approach to classifying mortgaged homebuyers. Staff Analytical Note 2022-1, Bank of Canada.

Statistics Canada. (2021). “Canadian Housing Statistics Program, 2020.” The Daily. September 17, Statistics Canada Catalogue no. 11-001-X. https://www150.statcan.gc.ca/n1/daily-quotidien/210917/dq210917b-eng.htm

Statistics Canada. (2022). “To buy or to rent: The housing market continues to be reshaped by several factors as Canadians search for an affordable place to call home.” The Daily. September 21. Statistics Canada Catalogue no. 11-001-X. https://www150.statcan.gc.ca/n1/daily-quotidien/220921/dq220921b-eng.htm

Statistic Canada. (2022). “Canadian Housing Statistics Program, 2019 and 2020.” The daily. November 11. Statistics Canada no.11-001-X. https://www150.statcan.gc.ca/n1/daily-quotidien/221110/dq221110c-eng.htm

Statistics Canada. (2022). Census Profile, 2021 Census. Statistics Canada Catalogue no. 98-316-X2021001. Last updated on September 21, 2022. https://www12.statcan.gc.ca/census-recensement/2021/dp-pd/prof/index.cfm?Lang=E

Teranet. (2022). Market Insight – The Canadian Source for Housing Information – Q2 2022, https://www.teranet.ca/wp-content/uploads/2022/06/Teranet-Market-Insight-Quarterly-Report-Q2-2022.pdf (accessed September 12, 2022).

Bad News Greets Residential Home Investors and Real Estate Agencies in the First Weeks of 2023

Bad News Greets Residential Home Investors and Real Estate Agencies in the First Weeks of 2023

The conclusion of 2022 was not kind to household serious estate traders or those whose organizations offer and finance homes. Not only did mortgage desire rates climb again at the end of December, but programs were down by double digits, in accordance to the House loan Bankers Association (MBA).

The common interest level for 30-yr set mortgages for loans with a 20{d4d1dfc03659490934346f23c59135b993ced5bc8cc26281e129c43fe68630c9} down payment enhanced to 6.58{d4d1dfc03659490934346f23c59135b993ced5bc8cc26281e129c43fe68630c9} from 6.34{d4d1dfc03659490934346f23c59135b993ced5bc8cc26281e129c43fe68630c9} two weeks in advance of. For reference, the rate was 3.33{d4d1dfc03659490934346f23c59135b993ced5bc8cc26281e129c43fe68630c9} at the end of 2021. In the meantime, house loan applications had been down 13.2{d4d1dfc03659490934346f23c59135b993ced5bc8cc26281e129c43fe68630c9} at the stop of 2022 in comparison to two weeks earlier. To include to the destructive information, the demand from customers for refinancing dropped 16.3{d4d1dfc03659490934346f23c59135b993ced5bc8cc26281e129c43fe68630c9} from two months earlier and 87{d4d1dfc03659490934346f23c59135b993ced5bc8cc26281e129c43fe68630c9} from the exact time period in 2021.

“Mortgage fees are lower than October 2022 highs but would have to decrease substantially to generate added refinance action,” MBA economist Joel Kan explained. “Purchase purposes have been impacted by slowing property sales in each the new and existing segments of the sector. Even as household-rate progress slows in several sections of the nation, elevated home loan charges carry on to place a pressure on affordability and are keeping possible homebuyers out of the market.”

Most current Choices on Benzinga’s Actual Estate Expense Screener

Realtor.com predicts mortgage price boosts will proceed into 2023 and will hover all over 7.1{d4d1dfc03659490934346f23c59135b993ced5bc8cc26281e129c43fe68630c9} by the conclusion of the 12 months. Straining to obtain any very good news at all, Real estate agent.com added, “Remember, that is reduced than the 7.76{d4d1dfc03659490934346f23c59135b993ced5bc8cc26281e129c43fe68630c9} typical charge noticed in 30-year mortgages considering that 1971.”

Erika Giovanetti, a U.S. Information & Planet Report reporter, claimed that dependent on lessons figured out in the late 1970s, house price ranges dwelling price ranges may keep their values more time than some predicted before in the calendar year.

“When mortgage rates rose quickly throughout the late ’70s and early ’80s, home selling price appreciation decelerated, but advancement remained positive. Residence rates did not drop right up until soon just after when a recession was underway,” she wrote. “So if the Federal Reserve can regulate to stick a soft landing — that is, by tempering inflation with no driving the U.S. economic climate into a recession — then bigger dwelling prices may well be below to continue to be.”

Verify Out Far more on Serious Estate from Benzinga

Will not miss real-time alerts on your stocks – be part of Benzinga Professional for totally free! Try the resource that will aid you devote smarter, faster, and better.

© 2023 Benzinga.com. Benzinga does not provide investment decision information. All legal rights reserved.

Michigan’s residential real estate market cooling after record extremes

Michigan’s residential real estate market cooling after record extremes

Consequences of rising inflation, fascination fees

It’s challenging for the ordinary individual to see the market place change soon after news of file large residence costs established in June, when the countrywide median sale for a one family home hit $416,000, up 13.4 p.c from a calendar year earlier. In Michigan, the average dwelling rate was $284,466, up 17 p.c from the very same month in 2021.

“It’s tricky for sellers to get to that arrive-down off that superior we’ve had,” Smith said. “But to have a consumer who can snooze on (irrespective of whether they want to make an give) is a a great deal more healthy atmosphere than what we’ve been living by means of.”

So considerably, Elsea mentioned, “it’s even now a seller’s marketplace,” but larger lending rates show up to be acquiring an effect. 

A normal 30-calendar year mortgage loan this week would have an interest price of close to 5.9 p.c, up from final year’s 3.5 per cent, incorporating $144 to the monthly expense of a loan for each $100,000 borrowed. Borrowers with prime credit and 20–percent down payments will pay marginally a lot less, all-around 5.4 per cent. The superior this calendar year was 6.18 per cent, established in June.

The genuine estate marketplace contends that particularly minimal fascination premiums were an anomaly that lasted for years due in component to the pandemic and federal efforts to encourage borrowing.

Now, mortgage loan charges are mounting as the Federal Reserve will increase the federal cash price (the rate loan providers pay to borrow from every other). It went up ¾ of a percentage level in July, and it is anticipated to bounce yet again in September, just after warnings that inflation experienced not nevertheless cooled sufficient.

The federal funds raise, in turn, has an effect on lots of consumer credit score interest charges, these as people associated with credit score cards and dwelling equity lines of credit history, while the price is not immediately tied to mortgage loan improves.

Individuals prices are raising as inflation proceeds to force most other client prices, such as food stuff, which continued to rise in July even as the annualized inflation fee remained steady that month at 8.5 p.c. 

The Fed warned this thirty day period of an additional feasible fee raise in September.

Household buyers truly feel the improvements, a lot of Realtors said.

“There is a lot less traffic, telephone phone calls and wander-ins,” stated Craig Hinkle, broker/operator of RE/MAX of Grayling.

“I sense that prospective buyers are obtaining particularly discouraged,” he said. “They’d go to glance at anything and make an present, and there would be several bids. … Now when they locate some thing, curiosity premiums have doubled. So we’re noticing some pullback.”

Authentic Estate 1 officials are also tracking the quantity of new listings. In southeast Michigan, far more homes priced at $750,000 or more are moving into the marketplace than a year in the past.

Listings of residences priced at under $500,000 — like the starter selection of under $250,000 — have declined. 

The increased-priced households are selling better than a calendar year ago, way too.

“The lower rate drops mirror the amplified value of homeownership, a mix of improved fascination charges and better selling prices,” Elsea stated. “The upper conclude (income) are much less influenced by the enhanced fascination rates.”

Rural marketplaces slowing much more immediately

Throughout the point out, when a property is priced suitable and seems to be ready for shift-in, sellers in even larger metropolitan areas can nevertheless expect an provide shortly following listing, Smith claimed. 

But income in rural communities are slowing.

“My colleagues, I assume, are talking about a tiny a lot more grim problem, specially in not such intense marketplaces,” Smith explained.

A single instance, Smith stated, was a builder of a new household in the northeast Decrease Peninsula who planned to checklist it shortly for about $250,000 and worried about no matter whether the time hold off would consume into his revenue as product sales dropped in the area.

“I feel that you will find nonetheless a digital divide,” Smith additional. “If individuals can get good world wide web access and they can sit on the lakefront, they are going to do it all working day extensive. If you don’t have that access, you are heading to take a big strike.”

By way of June, the lowest price appreciations in the point out have been in the Branch County and Clare-Gladwin spots, followed by Shiawassee County and the Thumb place.

The greatest calendar year-to-day regular income selling prices as of June ended up in the Traverse City region ($457,262) and the higher Ann Arbor space ($436,045), two communities with considerably far more buyers than houses on the marketplace and, as a result, climbing affordability worries.

In Grand Rapids, exactly where the variety of prospective buyers continue to considerably exceed provide, rates are not declining nevertheless, stated Edward Pinto, director of the AEI Housing Middle, a Washington, D.C. coverage feel tank. Additional properties must get to the marketplace for price ranges to come down, he included.

Grand Rapids “is even now pretty considerably from obtaining a selling price drop,” Pinto instructed the viewers at the Grand Rapids Coverage Convention, organized by the Grand Rapids Space Chamber of Commerce, on August 17.

Some Michigan waterfront residence also continues to increase amid extreme demand from customers. “Our shelves are vacant,” explained Hinkle, the Grayling broker, when it comes to properties with lake or river frontage.

That’s not the case with all of the attributes in the bigger Grayling place, Hinkle included. A household with noticeable flaws or updating desires won’t get major greenback or — if priced at the major of the current market — will linger as likely potential buyers reject it.

“Buyers do not want to purchase properties that have to have operate,” Hinkle reported. 

Smith said she’s found that in the larger Ann Arbor region via her brokerage and statewide in her purpose as an officer at MAR. 

Her tips to sellers agents is to contemplate a price tag reduction if it has not been given an offer you in the to start with 10 days on the industry. 

That is a attitude alter for agents and sellers, stated Elsea, of True Estate One.  

“If you’re employed to owning a dwelling market in a week for around asking price tag, and it modifications to 4 weeks at marginally underneath asking price,  then you imagine this is a major modify.

“But we are shifting to ordinary,  which is healthful simply because the pace we ended up at right before was not.”

Newly built Miami residential tower becomes bridge between cryptocurrency and real estate

Newly built Miami residential tower becomes bridge between cryptocurrency and real estate

The cryptocurrency sector is usually regarded for its uncertainty its underlying technologies signify a key disruption throughout industries, these as finance, gaming and offer chain. Consequently, asset rates rise and tumble alongside modifications in regulatory measures and new programs for the know-how. 

Most prosperous traders would agree that investing is about balancing higher-possibility and reduced-hazard property to reduce decline and improve earning prospective as a result of diversification. As a outcome, traders generally create portfolios that blend actual estate assets, shares and electronic currencies to assure their portfolio is correctly diversified for good results.

With this in brain, PMG and Greybrook have partnered with FTX US, a crypto exchange platform, to launch The Elser Hotel & Residences Miami which will allow buyers to make the most of volatile crypto belongings to obtain more secure real estate assets in a a lot more accessible way.

The Elser Hotel & Residences

A luxury making in need

The Elser Resort & Residences launched this summer time as a new 49-story luxurious condominium designed in Downtown Miami, located across from the perfectly-recognised FTX Arena. The setting up is made up of entirely furnished residences, a myriad of curated facilities and professional retail space. Through The Elser Hotel & Residences Owners Application managed by Highgate, the assets will let homeowners to enter a limited-phrase rental method with every day rental alternatives.

Searching closer at the growth alone, The Elser Resort & Residences delivers features which includes a double-level deck spanning over 19,000 sq. feet overlooking Downtown Miami and Biscayne Bay, a 132-foot resort-style pool with accompanying lounge parts and a 16-foot poolside LED wall. Additionally, extensive-phrase visitors can consider benefit of co-performing areas, present day gyms, fitness studios, bike storage, a yoga garden, an on-internet site substantial-end espresso store and a Jaguar Sunshine cafe bar and lounge.

“We are quite energized to be launching The Elser Hotel & Residences Miami, with each other with PMG, in purchase to capture the sturdy need for move-in all set residences in the Downtown Miami market,” states Peter Politis, CEO of Greybrook Realty Companions. “The brief-phrase rental optionality available to owners, coupled with the high caliber of finishes and offerings, will continue to provide the city as it  experiences a inhabitants, tourism and company relocation increase.”

A reduced-barrier bridge

The Elser Hotel & Residences proves by itself a top-tier genuine estate expense with a location acknowledged for staying among the the best in luxury true estate. But earlier mentioned and over and above getting a great home, the making proves alone a worthwhile, reduced-barrier investment as well. The way the buy agreement is arranged, worldwide purchasers are specified a chance to invest in a condo applying cryptocurrency without the classic hurdles that come with global banking companies and exchanges.

Ryan Shear, PMG’s handling director shares, “We saw an option to enable people to diversify their cryptocurrency property and effortlessly transfer resources into secure, bodily genuine estate. And accepting crypto offers prospective buyers a more available way to do that and order units. Blockchain and electronic currencies expedite the paying for procedure and reduce limitations global buyers confront, which is a essential software for creating in a escalating international town this sort of as Miami.”

Residences are currently priced from the $600,000s but are also accessible at an equivalent cryptocurrency exchange amount through an exceptional settlement with FTX US as the sole system handling cryptocurrency conversions for deposits and residential transactions.

Spurring on cryptocurrency growth

These large-close homes properly turn out to be much more than just an chance for financial investment into the worthwhile Miami actual estate industry — they also supply users a bridge for diversification from the cryptocurrency industry to authentic estate. 

The Elser then will become a testomony to the expanding desire for cryptocurrency investments — especially in Miami. Appropriately, partnerships like this carry on to be essential to Miami’s forward contemplating and expansion as an epicenter for the cryptocurrency industry.

Disclaimer. Cointelegraph does not endorse any content or product on this site. Though we purpose at offering you with all critical facts that we could get, readers should do their possess exploration just before getting any steps similar to the organization and have full accountability for their choices, nor can this short article be viewed as as investment guidance.

Manhattan residential real estate sales hit record .3 billion in first quarter

Manhattan residential real estate sales hit record $7.3 billion in first quarter

Luxurious higher-rise flats are considered throughout Central Park South near Columbus Circle in the Manhattan borough of New York.

Robert Nickelsberg | Getty Pictures

Manhattan residential actual estate income topped $7 billion in the first quarter, marking the strongest-ever commence to a calendar year as the marketplace reveals no indicators of slowing, according to new profits info.

There have been 3,585 profits in the 1st quarter, the highest amount at any time for a initial quarter, in accordance to a report from Miller Samuel and Douglas Elliman. Which is up 46{d4d1dfc03659490934346f23c59135b993ced5bc8cc26281e129c43fe68630c9} from the very first quarter of 2021. Total product sales quantity surged by 60{d4d1dfc03659490934346f23c59135b993ced5bc8cc26281e129c43fe68630c9} to in excess of $7.3 billion, as falling inventory also led to ongoing expansion in rates.

The common selling price of a Manhattan condominium jumped 19{d4d1dfc03659490934346f23c59135b993ced5bc8cc26281e129c43fe68630c9} over the former year’s period, to $2,042,113.

The energy arrived irrespective of soaring fascination prices, worries about a attainable recession and slipping stocks, which have a tendency to have an outsize impression on the Manhattan genuine-estate marketplace offered the city’s dependence on the fiscal marketplace.

It won’t glance like a force for a return to the workplace is driving the raise, possibly. Only about 36{d4d1dfc03659490934346f23c59135b993ced5bc8cc26281e129c43fe68630c9} of New York workers have returned to the office environment, according to facts from Kastle Devices.

Jonathan Miller, CEO of Miller Samuel, the appraisal and research corporation, reported the assumption that people dwell in Manhattan because of their jobs is now remaining challenged.

“You have a whole lot of people today who are doing work remote, but want to be in Manhattan,” he explained. “They’re captivated to the cultural offerings, the eating places, Broadway. Distant do the job isn’t going to just necessarily mean the suburbs. There could be as lots of people doing work remotely on the Upper East Facet of Manhattan as there are in Westchester.”

Rising desire rates also have significantly less impression on wealthy purchasers, who dominate the Manhattan sector. As prices go up, they just pay far more hard cash. Much more than 47{d4d1dfc03659490934346f23c59135b993ced5bc8cc26281e129c43fe68630c9} of all true-estate purchases in the quarter have been all-cash, up from the pandemic very low of 39{d4d1dfc03659490934346f23c59135b993ced5bc8cc26281e129c43fe68630c9}, and nearer to the historic norm.

A further explanation for Manhattan’s toughness at the get started of 2022 was source. Though the rest of the country grapples with a lack of households for sale, Manhattan continue to has ample inventory, even even though it is declining. Just about 5,000 listings strike the current market in the quarter, the most of any initially quarter on file, according to Corcoran. Nonetheless for the initial time in 5 many years, stock dipped below 6,000 units.

“With sturdy profits and strengthening charges, barring any unforeseen shocks, this stellar very first quarter should have everyone experience very optimistic about an additional momentous yr ahead,” said Pamela Liebman, Corcoran’s president & CEO.

The question is how much higher Manhattan rates can go before customers start backing down from bargains. The median cost of a Manhattan condominium hit an all-time file of $1,190,000 in the first quarter. The median value for new progress topped $2.3 million.

The most significant price tag gains are at the top rated. Rates for flats with 4 or a lot more bedrooms jumped 31{d4d1dfc03659490934346f23c59135b993ced5bc8cc26281e129c43fe68630c9} about past yr, to $6.5 million. As consumers droves costs greater, only 20{d4d1dfc03659490934346f23c59135b993ced5bc8cc26281e129c43fe68630c9} of residences bought went for fewer than $1,200 a square-foot, the least expensive percentage on report, according to Corcoran. 

Nonwovens Have a Home in Residential & Commercial Furnishings – Nonwovens Industry Magazine

Nonwovens Have a Home in Residential & Commercial Furnishings – Nonwovens Industry Magazine

Nonwovens producers that manufacture items for residential and commercial areas are expressing optimism. Many of these manufacturers are attributing growth in groups these types of as wallcoverings, furniture, bedding and acoustics, between others, to home advancements that have taken put all through the coronavirus pandemic. Excess time at house above the previous two decades has presented people an prospect to make aesthetic and structural alterations to their homes. At the exact same time, as properties and workplaces proceed to open up, corporations are reshuffling layouts to give employees far more comfy individual space.

In accordance to Henrik Kjeldsen, CCO of Fibertex Nonwovens, which supplies a range of products for the home furnishings, bedding, flooring and indoor acoustic industries, the Covid-19 pandemic has improved small business in these segments. “It seems that several families have invested in household advancements all through the pandemic as more time has been spent at dwelling and limits have resulted in discounts on vacation and eating places expenses, which has been made use of to enhance high-quality of life at household,” he suggests.

For the duration of this time Fibertex has viewed a craze to improved acoustic environments at residence, as very well as in the office. The business types a assortment of sound absorbing nonwoven solutions for ceilings and walls, which features producers, architects and specifiers advanced acoustic overall performance. A number of of these products and solutions have been released fairly recently and have already received a favourable response in the industry, Kjeldsen clarifies. “Most importantly, as noise is annoying by definition, these products and solutions strengthen high quality of life both at house and work because of to very enhanced acoustic general performance,” he says. “Likewise, there is a pattern toward improved strolling ease and comfort relating to the flooring marketplace and on improved impression sound damping within just the building business.”

An additional classification that has been carrying out effectively as of late is wallcoverings. As consumers have been inspired to shell out much more time in their homes for the duration of the pandemic, Anna Brikh, products manager BU nonwovens, Ahlstrom-Munksjö, suggests they desired to make these places additional cozy, purposeful and as reflecting of their individuality as possible. “Changing wall decor is a fantastic way to achieve these ambitions,” she provides. “We are self-confident that nonwoven wallcoverings will maintain on growing their presence on the wall decoration marketplace.”

The Finnish nonwovens producer makes wetlaid and drylaid (needlepunch) nonwovens for wallcoverings at vegetation in Malmedy, Belgium Brignoud, France Arches, France and Windsor Locks, CT, in the U.S. The corporation a short while ago doubled production capacity at its Malmedy plant, a €10 million financial commitment, which diversified the generation to also cover filtration resources.

Ahlstrom-Munksjö provides a extensive vary of nonwovens for the significant-stop wallcoverings segment. According to the enterprise, the current market for higher-finish wallcoverings is anticipated to continue to improve because of to amplified need for digitally printed wallcoverings, new and ground breaking textures and colors, supported by increased customers’ need for household decoration and new trends in interior design.

“This expenditure will even further improve Ahlstrom-Munksjö’s situation in offering one of a kind fiber-based mostly alternatives for equally wallcovering and filtration marketplaces. It highlights our agility in responding to variations in industry desire and permits us to assist our clients also in the future,” suggests Pierre Mary, vice president, Nonwovens and Abrasives. 

In new product or service news, Ahlstrom-Munksjö not too long ago improved its WallStar variety with new purposeful items. WallStar is an considerable vary of high quality high-quality facings and backings for higher-conclusion and luxury wallcoverings. Section of WallStar, WallStar Digital is its widest array of electronic nonwovens suited for all digital printing technologies. They comprise huge variation in structure and surface area outcomes. Meanwhile, the company’s WallStar Going through FiberArt vary of Premium wallcoverings has been enriched by a new substantial fibrous nonwoven in 130 gsm. The quality is suited for direct printing with screen know-how. “This new quality completes our array of fibrous area nonwovens and satisfies the marketplace request for structured wallcoverings whilst providing authentic aspect to the walls,” says Brikh.

Moreover, its array of nonwovens for digital printing has a new WallStar Digital significant body weight solution, Matte Strong 240, which has a high amount of thickness and opacity. It also gains from a significant tear index and fitting with U.S. Type 2 needs. “It also features recycled artificial fibers, allowing for us to suggest a genuinely sustainable alternative to PVC-coated products,” Brikh describes.

The company’s wallcovering variety also consists of Ahlstrom-Munksjö WallWise, the widest selection of price-for-cash nonwoven facings and nonwoven and paper backings, developed to provide competitive rewards at an inexpensive price tag, and Ahlstrom-Munksjö Wall Liners, substantial top quality nonwovens developed for overpainting, for both equally the professional and household marketplaces. 

A further professional in the wallcoverings spot is Lahnpaper of Lahnstein, Germany. Lahnpaper’s basepapers are made on a unique inclined-wire paper device in a wetlaid procedure, followed by a array of finishing choices, as well as calendering and/or coating devices. Launched in 1911, the company has around 100 many years of practical experience in the progress, manufacture and processing of fiber solutions these as specialty papers and nonwovens.

Lahnpaper’s most recent products and solutions are nonwovens with better opacity and a smooth area to get improved printing benefits. Shortly, the organization ideas to launch an optimized carbon footprint product or service, as the topic sustainability is pretty vital to the organization.

When compared to paper-based mostly wallcoverings, nonwoven-dependent wallcoverings have numerous benefits, including, for case in point, “paste-the-wall,” suggests Uljana Nowak, business device manager Wallcovering, Lahnpaper. “You can straight place the wallpaper on the glued wall and will not reduce time for slicing and making ready the wallpaper in progress. Nonwovens are dimensionally steady and can be easily put off the wall yet again, as they are dry-strippable. Renovation and decoration are quite quick.”

In Europe, Nowak claims there is a craze to have smooth walls and there is one more pattern to adorn individually. “For both of those traits, Lahnpaper GmbH has excellent answers: clean nonwovens for easy walls, and nonwovens for electronic printing, exactly where the client can make a decision the design he likes for his wall,” she points out.

On the sustainability front, Lahnpaper has implemented an electrical power management technique and is accredited in accordance to DIN EN ISO 50001, as very well as in accordance to DIN EN ISO 9001 for quality administration. Its merchandise are accredited for sustainably managed forests (FSC COC). Lahnpaper is also permanently tests sustainable and renewable uncooked elements and is working consistently on optimizing the carbon footprint of its items.

Through the pandemic, Nowak says there was a massive desire for wallcoverings, and the market expert massive growth in turnover. “Due to the pandemic restrictions, persons have been forced not to journey and to stay at house, so they experienced much more time to devote their time in renovation and make their residence cozier.”

In the yrs in advance, the business expects the sector to be steady.

In the wallcovering classification DuPont manufactures a polyvinyl fluoride (PVF) film termed Tedlar, which can be laminated to nonwovens, as perfectly as wovens and paper, to drastically enrich the wallcoverings longevity and cleanability. Tedlar has also been utilised in purposes ranging from metallic developing exteriors, to aircrafts, to solar panels and substantially more for over 60 many years.

Tedlar movie for wallcovering gives a protective barrier against a variety of cleaning agents and solvents, this means the wall is extremely washable and remains undamaged, with a great-as-new look that can be taken care of above a prolonged time period of time. “This cleanability is significantly essential in a put up-Covid planet,” states Corynn Sheridan, world-wide advertising and marketing supervisor, DuPont. “It was always significant in health care spaces and places to eat, but it is turning out to be more emphasised in other areas as very well, this kind of as colleges and hospitality.”

Tedlar film can be printed on and is compatible with a array of wallcovering sorts. It is also stain/graffiti as effectively as mildew and mildew resistant.

On top of that, wallcoverings laminated with Tedlar can be GreenGuard Gold Qualified, this means they lessen emission of VOCs and can lead to LEED and other environmental certs for a making. “Tedlar film takes a Sort 2 wallcovering to a Type 3 wallcovering (at Form 2 bodyweight) by furnishing the maximum degree of wall defense, outstanding for high site visitors areas that demand sturdiness and straightforward-clean up,” suggests Sheridan. “Because of the longevity of Tedlar, it lowers the need to have to switch wallcoverings in demanding and large site visitors regions, defending a creating owner’s financial investment and cutting down substance use more than the life span of a place.”

From a development point of view, DuPont is looking at growing developments for wallcovering, as perfectly as a great deal of interest in graphic printing. “I believe the development towards wallcovering, from my knowledge and what we’re hearing from our clients, has a lot to do with it being a a lot more sustainable and really customizable inside décor alternative,” Sheridan suggests. “Wallcoverings are also coming again into vogue in household, so that’s exactly where we’re observing a large amount of the expansion now.”

&#13
In the household textiles market, just one of Freudenberg Overall performance Materials’ newest offerings is Evolon New Era, which is twice as dense as the authentic Evolon, appreciably expanding its filtration general performance.

“Thanks to a ideal stability of breathability, permeability to drinking water vapor and thermal insulation, Evolon New Era delivers the greatest mix of thermo-physiological houses for unparalleled comfort and ease,” says Frank Heislitz, CEO, Freudenberg Performance Products. “Furthermore, with its premium look and luxury experience, Evolon New Generation complements the unique Evolon by building a new product or service for best-top quality mattress linen.”

Evolon technological know-how is usable in washable, durable programs in household furnishing. With Evolon New Era, Freudenberg has opened up new perspectives by fulfilling the toughness demands of the resort and healthcare facility sectors for bedding.

On top of that, Evolon New Era products and solutions for bedding purposes are endorsed by Eco-Check since they provide increased longevity and lessen environmental footprint in excess of the complete lifecycle. Freudenberg introduced the Eco-Check label in 2020 to help customers speedily determine sustainable items.

Right now, design tendencies are highly influenced by consolation and sustainability, with recycled written content, recyclability, mild pounds and longevity gaining more and more great importance, in accordance to Dr. Heislitz. “Architects, property furnishing corporations and development providers are asked for by their customers to use elements and merchandise with small environmental footprint,” he says. “In this make any difference, Freudenberg engineers do the job repeatedly to lessen our manufacturing footprint and help our consumers to boost their handprint.”

Requests for lighter body weight solutions have been pushed around the earlier handful of decades. “Lighter weight is normally ‘greener,’ and this has led to most important carpet backing weights decreasing this year,” he provides.

In 2021, Freudenberg launched Evolon RE manufactured from recycled PET designed bottles. One one mom roll with an average of 2000 sqm of typical Evolon RE product offers new existence to roughly 5500 plastic bottles. Freudenberg also strives to supply lighter items even though growing the toughness and wash resistance.

On top of that, thanks to the turbulent market disorders in 2021, one of Freudenberg’s focuses was to guarantee reliable source of frequent higher-quality merchandise to its clients. “Following Freudenberg’s commitment to sustainability, we have been operating on the ecological foot- and handprint of our spunbond nonwovens,” Heislitz says. “Measures to cut down CO2 emissions through generation and developments to permit carpet recyclability at the finish of a product’s lifetime are ongoing.”

&#13
Throughout 2021, New Jersey-based Precision Textiles was in enlargement manner. In October the supplier of coated fabrics, nonwovens and laminations for the bedding, automotive and health care industries, opened its new 160,000 sq.-foot plant located on a 25-acre campus in Troy, NC.

Soon after 34 yrs of manufacturing products domestically solely out of its headquarters facility in Totowa, NJ, Precision Textiles’ next manufacturing facility is positioned near numerous of the company’s consumers in the bedding industry. Proximity was important variable in Precision Textiles’ decision for the place of the web page.

“This locale puts us proper the place we require to be,” Scott Tesser, CEO, said throughout the opening of the new facility. “We have been production out of our New Jersey facility for numerous a long time, and now we’re using the up coming action. It is vital to our progress to be found proper in this article, in the heart of one particular of the biggest spots for bedding production in the Southeast. This opening marks our motivation to the sector, our clients and also our staff members.”

As soon as a textiles generation plant that serviced the vehicle marketplace, the Troy facility will finally double the manufacturer’s needlepunch nonwovens manufacturing and enhance its highloft quilting fiber output by 50{d4d1dfc03659490934346f23c59135b993ced5bc8cc26281e129c43fe68630c9}. The new manufacturing facility will enable Precision to much better provide the needs of its prospects all through the country and, in particular, lessen shipping and delivery occasions for its shoppers in the Southeast. The additional capacity will also empower the organization to meet the wants of both equally existing and new buyers as it seeks new avenues for expanding its company down the road.

In the meantime, in November, Precision Textiles declared ideas to open a nonwovens plant at a 50,000-square-foot production and distribution middle in Phoenix, AZ, that will provide its consumers all over the western U.S.

“Demand for our items is large in the bedding industry, which has fueled our enlargement. The Arizona facility is close in proximity to numerous of our prospects, which was a main factor in the alternative for this place. Not only will it allow us to be more responsive to our partners in the western region, but it will also permit us to lower shipping time and provide product or service to them additional successfully,” states Tesser.

In new product or service information, Precision lately introduced PurLoft to support brands fulfill purchaser demand for natural, far more sustainable mattresses. PurLoft is an environmentally welcoming option to 100{d4d1dfc03659490934346f23c59135b993ced5bc8cc26281e129c43fe68630c9} synthetic substantial loft hearth barriers for bedding products and solutions. It is supplied in different weights and manufactured with renewable wool fibers, which are obviously flame retardant. Incorporating wool straight underneath the sleep area features a substantial-general performance, sustainable different that is not only FR compliant, but also produces air pockets, which act as normal insulators to help control entire body temperature. PurLoft also offers remarkable moisture management as effectively as odor and allergen defense. In addition, the normally crimped wool fiber will help products retain shape lengthier, producing it additional durable.