Overview
For the first time, the Canadian Housing Statistics Program (CHSP) is publishing data on investors. This article presents a profile of these owners and the residential properties they owned in the provinces of Nova Scotia, New Brunswick, Ontario, Manitoba and British Columbia in 2020.
Key findings
- The proportion of investors among owners varied from 20.2{d4d1dfc03659490934346f23c59135b993ced5bc8cc26281e129c43fe68630c9} in Ontario to 31.5{d4d1dfc03659490934346f23c59135b993ced5bc8cc26281e129c43fe68630c9} in Nova Scotia.
- Among houses and condominium apartments, just under one in five properties was used as an investment in British Columbia, Manitoba, Ontario, New Brunswick and Nova Scotia combined.
- Condominium apartments were used as an investment more often than houses (single-detached houses, semi-detached houses, row houses, and mobile homes). Ontario topped the list with the highest rate of condominium apartments used as an investment, at 41.9{d4d1dfc03659490934346f23c59135b993ced5bc8cc26281e129c43fe68630c9}.
- Houses used as an investment were mainly owned by individuals living in the same province as the property.
Introduction
Residential properties can be owned for several reasons: for use as a primary place of residence, but also for occasional use as a secondary residence, to generate income or other investment purposes. When properties are owned by investors, they can contribute to the rental housing supply—and therefore meet the population’s need for rental housing—but that can also limit the number of properties available to buyers who intend to use it as a primary place of residence. Data from the 2021 Census showed that the proportion of Canadian households who owned their home fell from 69.0{d4d1dfc03659490934346f23c59135b993ced5bc8cc26281e129c43fe68630c9} in 2011 to 66.5{d4d1dfc03659490934346f23c59135b993ced5bc8cc26281e129c43fe68630c9} in 2021. This article distinguishes between investors and other types of owners to better understand the profile of investors, what they own, and the role they play in the market.
This topic is especially important since, in the United States, the study by Haughwout et al. (2011) showed an increase in the proportion of investors among buyers from 2000 to 2007, when a housing bubble emerged. These borrowers then contributed considerably to the rise in delinquency rates during the 2007/2008 housing crisis. Analyzing the subsequent period in the United States (2009 to 2013), the study by Allen et al. (2018) also found that an increase in the percentage of houses purchased by investors in a given area led to higher prices in that market.
North of the border, the Bank of Canada (2022) analyzed the importance of investors—defined as buyers who own multiple mortgaged properties—and found an increase in the proportion of purchases by investors in Canada in the first half of 2021. Teranet (2022) made a similar observation in an analysis of transactions carried out by owners of multiple properties in Ontario. The Canada Mortgage and Housing Corporation (2016) also investigated investors — defined as households who own a primary residence and at least one secondary condominium unit — using a survey of condominium owner households in Toronto and Vancouver. They found that 48.4{d4d1dfc03659490934346f23c59135b993ced5bc8cc26281e129c43fe68630c9} of investors in 2015 stated that their secondary unit was rented out while 42.0{d4d1dfc03659490934346f23c59135b993ced5bc8cc26281e129c43fe68630c9} stated that they or a family member were using the unit.
In this release, the CHSP follows a different approach by identifying properties owned by investors among the entire stock of residential properties in Nova Scotia, New Brunswick, Ontario, Manitoba and British Columbia for the reference year 2020.Note The findings provide a snapshot of the situation in these provinces before the COVID-19 pandemic and can therefore be used as a point of comparison to determine the effects of the public health crisis when examining subsequent years.
What is an investor?
In this analysis, owners are divided into three categories: investors, investor-occupants, and non-investors.
An investor is defined as an owner who owns at least one residential property that is not used as their primary place of residence. Individual owners who own a single property in the same province as where they reside are not considered investors, so long as it is not a property with multiple units.
Specifically, the following owners are considered to be investors:
- A business or government that owns at least one residential property, excluding Canadian non-profit organizations.Note Given the predominance of businesses in this category, they will simply be referred to as “business” in what follows.
- An individual owner who is not resident in Canada, referred to as a “non-resident investor” below.
- An individual owner who lives outside the province where they own residential property, referred to as an “out-of-province investor” in the province of the non-principal residence.
- An individual owner who lives in the province and owns two or more residential properties, or owns a property with multiple residential units who does not occupy that property. These individuals will be referred to as “in-province investors”.
The investor category thus can include, among others, secondary residence owners, landlords, short-term rental owners, developers, for-profit businesses and speculators.
An owner is classified as an investor-occupant if they own a single property with multiple residential units, one of which is their primary place of residence. For example, this category includes owners of a house with a laneway unit or basement suite and owners of a duplex who live in one of the units. In all cases, at least one of the units must be occupied by one of the owners.
An owner is classified as a non-investor when they are not an investor or an investor-occupant. This category primarily includes owners who live in the province where the property is located, who own a single property, and this property does not have multiple residential units. Canadian non-profit businesses are also included in this category.Note
More than one in five owners is an investor
For British Columbia, Manitoba, Ontario, New Brunswick and Nova Scotia combined, CHSP data show that a total of 21.9{d4d1dfc03659490934346f23c59135b993ced5bc8cc26281e129c43fe68630c9} of owners were investors in 2020. The proportion of investors was higher in Nova Scotia (31.5{d4d1dfc03659490934346f23c59135b993ced5bc8cc26281e129c43fe68630c9}) and New Brunswick (29.0{d4d1dfc03659490934346f23c59135b993ced5bc8cc26281e129c43fe68630c9}) than in British Columbia (23.3{d4d1dfc03659490934346f23c59135b993ced5bc8cc26281e129c43fe68630c9}), Manitoba (20.4{d4d1dfc03659490934346f23c59135b993ced5bc8cc26281e129c43fe68630c9}), and Ontario (20.2{d4d1dfc03659490934346f23c59135b993ced5bc8cc26281e129c43fe68630c9}).

Data table for Chart 1
| British Columbia | Manitoba | Ontario | New Brunswick | Nova Scotia | |
|---|---|---|---|---|---|
| percent | |||||
| Investor | 23.3 | 20.4 | 20.2 | 29.0 | 31.5 |
| Investor-occupant | 9.6 | 0.7 | 0.8 | 2.5 | 1.8 |
| Non-investor | 67.1 | 79.0 | 79.0 | 68.4 | 66.7 |
This difference is largely due to a higher proportion of vacant land in the two Atlantic provinces, which is a type of property often owned in addition to the primary place of residence. The proportion of investors who live in the province and own one or two pieces of vacant land in addition to their primary place of residence was 6.7{d4d1dfc03659490934346f23c59135b993ced5bc8cc26281e129c43fe68630c9} in Nova Scotia and 7.7{d4d1dfc03659490934346f23c59135b993ced5bc8cc26281e129c43fe68630c9} in New Brunswick. If we remove this type of investor, the rate of investors falls to 24.8{d4d1dfc03659490934346f23c59135b993ced5bc8cc26281e129c43fe68630c9} in Nova Scotia and 21.3{d4d1dfc03659490934346f23c59135b993ced5bc8cc26281e129c43fe68630c9} in New Brunswick. The proportions of investors are then more comparable to those of the other provinces.
Given that the stock of vacant land is proportionally lower and more expensive in British Columbia and Ontario, less than 2{d4d1dfc03659490934346f23c59135b993ced5bc8cc26281e129c43fe68630c9} of owners in these provinces were in-province investors who owned one or two pieces of vacant land in addition to their primary place of residence. In Manitoba, the proportion of homeowners in this situation was also low, at 2.5{d4d1dfc03659490934346f23c59135b993ced5bc8cc26281e129c43fe68630c9}.
Investor-occupants are more common in British Columbia, where they made up 9.6{d4d1dfc03659490934346f23c59135b993ced5bc8cc26281e129c43fe68630c9} of owners. This higher proportion is mostly due to the composition of the housing stock. In this province, properties with multiple residential units represented 11.7{d4d1dfc03659490934346f23c59135b993ced5bc8cc26281e129c43fe68630c9} of the stock, a higher proportion than in the other provinces, where it varied from 2.9{d4d1dfc03659490934346f23c59135b993ced5bc8cc26281e129c43fe68630c9} in Ontario to 5.7{d4d1dfc03659490934346f23c59135b993ced5bc8cc26281e129c43fe68630c9} in Nova Scotia. This higher percentage in British Columbia was mostly attributable to many residences with a laneway unit or a basement suite among properties with multiple residential units. These kinds of properties were more likely to be occupied by the owner when compared to apartment buildings in British Columbia and elsewhere.
How is the investment status of the property defined?
An analysis of properties used as an investment helps clarify the role that investors play in the housing market. The investment status of the property is determined by analyzing the investor status of the owner and the use of the property. Properties are divided into one of the following three categories: an investment property, an owner-occupied investment property, and a non-investment property.Note
An investment property is defined as a property owned by at least one investor that is not the primary place of residence of any of the owners. This can include, for example, a rented property with one or more units, a cottage or a property owned for speculative purposes.
If the property is not included in the previous category, it can be considered an owner-occupied investment property if it is a property with multiple residential units where at least one of the owners occupies a unit.Note
Finally, the non-investment property category includes properties owned only by non-investors or those used as a primary place of residence by at least one of the owners.
The proportion of investment properties varies greatly by the type of property analyzed. Vacant land and properties with multiple residential units are used more for investment than single-detached houses, semi-detached houses, row houses, and mobile homes — which we refer to as “houses” in this article — and condominium apartments.
In all the provinces analyzed in this study combined, more than 9 in 10 vacant lots were investment properties or were owned by a non-profit organization. The remainder were owned by individuals residing in the province where they owned a single vacant lot. Similarly, for all these provinces, 96.7{d4d1dfc03659490934346f23c59135b993ced5bc8cc26281e129c43fe68630c9} of properties with multiple residential units were either investment properties (45.6{d4d1dfc03659490934346f23c59135b993ced5bc8cc26281e129c43fe68630c9}) or owner-occupied investment properties (51.1{d4d1dfc03659490934346f23c59135b993ced5bc8cc26281e129c43fe68630c9}), while the rest were owned by non-profit organizations. However, these proportions varied from one province to another. In British Columbia, 73.0{d4d1dfc03659490934346f23c59135b993ced5bc8cc26281e129c43fe68630c9} of properties with multiple dwellings were owner-occupied investment properties. By contrast, in the other provinces, the majority of properties with multiple dwellings were investment properties, with the proportion reaching 72.0{d4d1dfc03659490934346f23c59135b993ced5bc8cc26281e129c43fe68630c9} in Manitoba.
As a result, provinces with a large stock of vacant land, such as New Brunswick and Nova Scotia, and those with a high proportion of properties with multiple residential units, such as British Columbia, had high rates of investors or investor-occupants. The portrait shifts when the focus is on houses and condominium apartments, which are more likely to be owner-occupied, and therefore not used for investment purposes. In the following sections, the analysis of properties focuses exclusively on houses and condominium apartments, and excludes properties with multiple dwellings and vacant land.
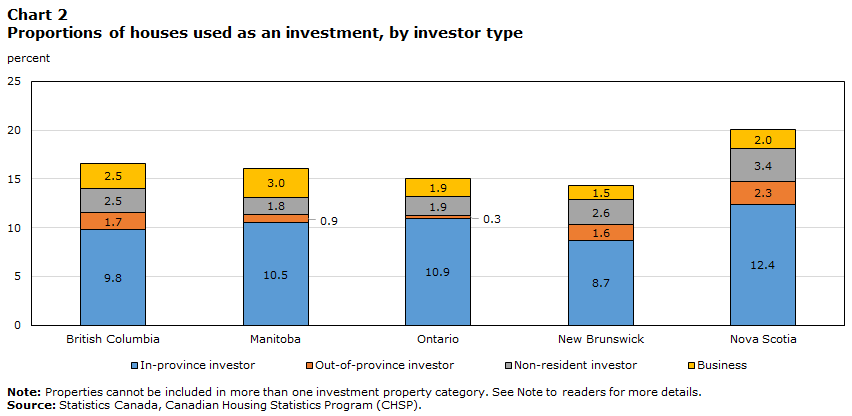
In Nova Scotia, more than 1 in 20 houses is used as an investment by a person living outside the province or the country
The analysis by property type found that investors were drawn more to condominium apartments than houses. The share of houses used as an investment varied from 14.3{d4d1dfc03659490934346f23c59135b993ced5bc8cc26281e129c43fe68630c9} in New Brunswick to 20.1{d4d1dfc03659490934346f23c59135b993ced5bc8cc26281e129c43fe68630c9} in Nova Scotia, with an overall average of 15.6{d4d1dfc03659490934346f23c59135b993ced5bc8cc26281e129c43fe68630c9} for all five provinces. By comparison, this same statistic for condominium apartments was 39.4{d4d1dfc03659490934346f23c59135b993ced5bc8cc26281e129c43fe68630c9}. For the five provinces, a total of 918,695 houses were used as an investment, 584,615 of which were in Ontario. A regional analysis found that the proportion of houses used as an investment was generally higher in more touristic regions, where there may be more cottages.
In-province investors owned, as investment properties, between 8.7{d4d1dfc03659490934346f23c59135b993ced5bc8cc26281e129c43fe68630c9} of the houses in New Brunswick and 12.4{d4d1dfc03659490934346f23c59135b993ced5bc8cc26281e129c43fe68630c9} in Nova Scotia, and, as such, they owned more houses used as an investment than all the other types of investors combined.
Data table for Chart 2
| British Columbia | Manitoba | Ontario | New Brunswick | Nova Scotia | |
|---|---|---|---|---|---|
| percent | |||||
| In-province investor | 9.8 | 10.5 | 10.9 | 8.7 | 12.4 |
| Out-of-province investor | 1.7 | 0.9 | 0.3 | 1.6 | 2.3 |
| Non-resident investor | 2.5 | 1.8 | 1.9 | 2.6 | 3.4 |
| Business | 2.5 | 3.0 | 1.9 | 1.5 | 2.0 |
Out-of-province investors owned proportionally fewer houses used as an investment in Ontario (0.3{d4d1dfc03659490934346f23c59135b993ced5bc8cc26281e129c43fe68630c9}) than out-of-province investors in the other provinces, which is likely partly due to higher real estate prices in Ontario than most of the provinces. Nova Scotia, New Brunswick and British Columbia seemed more popular with out-of-province investors, who owned, as investments, 2.3{d4d1dfc03659490934346f23c59135b993ced5bc8cc26281e129c43fe68630c9}, 1.6{d4d1dfc03659490934346f23c59135b993ced5bc8cc26281e129c43fe68630c9} and 1.7{d4d1dfc03659490934346f23c59135b993ced5bc8cc26281e129c43fe68630c9} of houses, respectively. New Brunswick and Nova Scotia may have attracted residents from other provinces with lower average housing prices than in other provinces. As for British Columbia, the number of out-of-province investors was particularly high in the areas near the Alberta border. In British Columbia, non-residents and out-of-province investors owned 43,890 houses used as an investment.
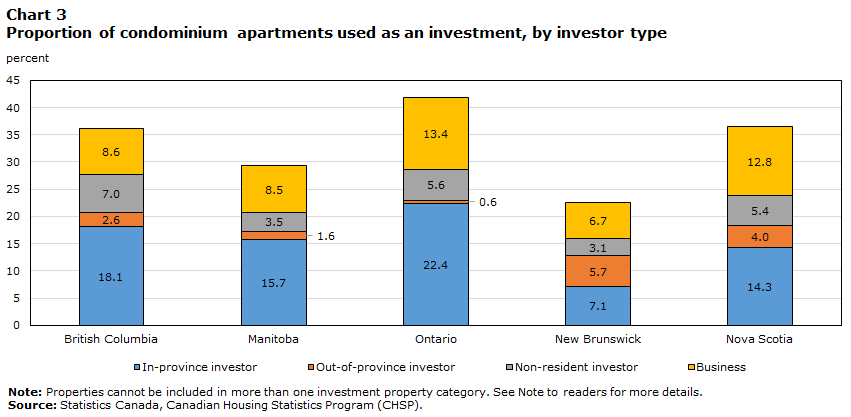
Condominium apartments are more popular with investors than houses
The share of condominium apartments used as an investment was higher than for houses, varying from 22.6{d4d1dfc03659490934346f23c59135b993ced5bc8cc26281e129c43fe68630c9} in New Brunswick to 41.9{d4d1dfc03659490934346f23c59135b993ced5bc8cc26281e129c43fe68630c9} in Ontario and totalling 39.4{d4d1dfc03659490934346f23c59135b993ced5bc8cc26281e129c43fe68630c9} for all five provinces. Although this share was higher in Ontario and British Columbia (36.2{d4d1dfc03659490934346f23c59135b993ced5bc8cc26281e129c43fe68630c9}) than in Manitoba (29.2{d4d1dfc03659490934346f23c59135b993ced5bc8cc26281e129c43fe68630c9}) and New Brunswick, this does not appear to be attributable to the large census metropolitan areas (CMAs) in those provinces. In fact, the rate of condominium apartments used as investment was lower in the CMAs of Toronto (36.2{d4d1dfc03659490934346f23c59135b993ced5bc8cc26281e129c43fe68630c9}) and Vancouver (34.0{d4d1dfc03659490934346f23c59135b993ced5bc8cc26281e129c43fe68630c9}) than the rate in the rest of their respective provinces.
Data table for Chart 3
| British Columbia | Manitoba | Ontario | New Brunswick | Nova Scotia | |
|---|---|---|---|---|---|
| percent | |||||
| In-province investor | 18.1 | 15.7 | 22.4 | 7.1 | 14.3 |
| Out-of-province investor | 2.6 | 1.6 | 0.6 | 5.7 | 4.0 |
| Non-resident investor | 7.0 | 3.5 | 5.6 | 3.1 | 5.4 |
| Business | 8.6 | 8.5 | 13.4 | 6.7 | 12.8 |
There was a higher rate of business-owned investment properties among the condominium apartment stock than in the stock of houses. In Ontario, businesses owned 74,485 condominium apartments for investment purposes, or 13.4{d4d1dfc03659490934346f23c59135b993ced5bc8cc26281e129c43fe68630c9} of all properties of this type, which is the highest share among the provinces analyzed. Nevertheless, most condominium apartments used as an investment in both Ontario and Manitoba were owned by in-province investors. In the other jurisdictions, this was not the case.
The proportion of condominium apartments owned for investment purposes by non-resident investors was the highest in British Columbia (7.0{d4d1dfc03659490934346f23c59135b993ced5bc8cc26281e129c43fe68630c9}), followed by Ontario (5.6{d4d1dfc03659490934346f23c59135b993ced5bc8cc26281e129c43fe68630c9}).
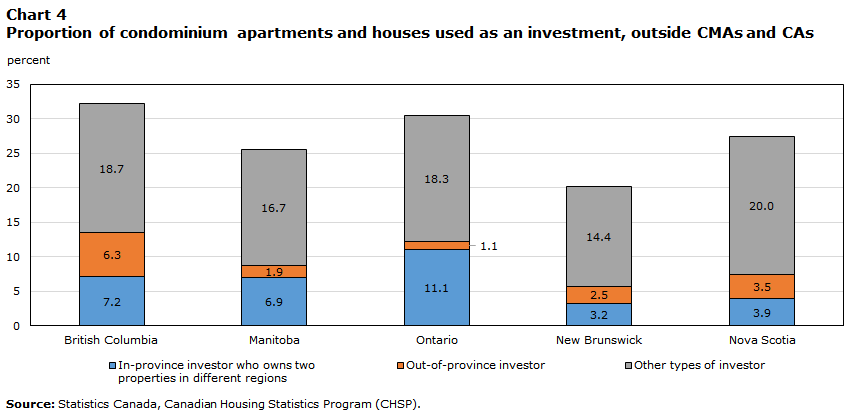
More investment properties outside CMAs and census agglomerations (CAs) seem to be used as a secondary residence
While some investors rent out their investment property, others may use it as a secondary residence. Properties located outside CMAs and CAs are more likely to be used as secondary or recreational properties, such as cottages, when the owners are residents of the province and only own one additional property outside the region of their primary residence.Note These properties may or may not be rented.
Outside the major centres, this type of investment made up between 3.2{d4d1dfc03659490934346f23c59135b993ced5bc8cc26281e129c43fe68630c9} of houses and condominium apartments in New Brunswick and 11.1{d4d1dfc03659490934346f23c59135b993ced5bc8cc26281e129c43fe68630c9} in Ontario. In the latter, this amounted to 70,610 properties, or 1.6{d4d1dfc03659490934346f23c59135b993ced5bc8cc26281e129c43fe68630c9} of all houses and condominium apartments in the province. Of these, more than 99{d4d1dfc03659490934346f23c59135b993ced5bc8cc26281e129c43fe68630c9} were houses, while condominium apartments, which are less common outside major centres, represented less than 1{d4d1dfc03659490934346f23c59135b993ced5bc8cc26281e129c43fe68630c9} of the investment properties of this type.
In British Columbia and, to a lesser extent, Nova Scotia, the share of potential secondary residences owned by out-of-province investors was higher than in the other jurisdictions. In British Columbia, investment properties owned by out-of-province residents represented 6.3{d4d1dfc03659490934346f23c59135b993ced5bc8cc26281e129c43fe68630c9} of the houses and condominium apartments outside CMAs and CAs, while the figure for Nova Scotia was 3.5{d4d1dfc03659490934346f23c59135b993ced5bc8cc26281e129c43fe68630c9}.
Data table for Chart 4
| British Columbia | Manitoba | Ontario | New Brunswick | Nova Scotia | |
|---|---|---|---|---|---|
| percent | |||||
| In-province investor who owns two properties in different regions | 7.2 | 6.9 | 11.1 | 3.2 | 3.9 |
| Out-of-province investor | 6.3 | 1.9 | 1.1 | 2.5 | 3.5 |
| Other types of investor | 18.7 | 16.7 | 18.3 | 14.4 | 20.0 |
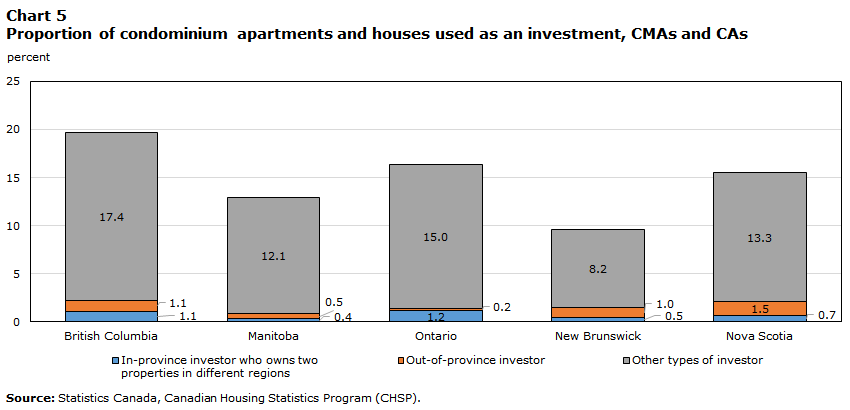
Although a secondary residence could also be a pied-à-terre in the city, this seemed less common. In large urban centres, the proportion of houses and condominium apartments used as an investment owned by residents from outside the region or the province was lower than in areas outside CMAs or CAs. This proportion was highest in the CAs and CMAs in Nova Scotia (2.2{d4d1dfc03659490934346f23c59135b993ced5bc8cc26281e129c43fe68630c9}) and British Columbia (2.2{d4d1dfc03659490934346f23c59135b993ced5bc8cc26281e129c43fe68630c9}). In CMAs and CAs of the five provinces, the second property of in-province investors living in a different region was more often a condominium (23.0{d4d1dfc03659490934346f23c59135b993ced5bc8cc26281e129c43fe68630c9} of cases) than was the case outside major centres.
Data table for Chart 5
| British Columbia | Manitoba | Ontario | New Brunswick | Nova Scotia | |
|---|---|---|---|---|---|
| percent | |||||
| In-province investor who owns two properties in different regions | 1.1 | 0.4 | 1.2 | 0.5 | 0.7 |
| Out-of-province investor | 1.1 | 0.5 | 0.2 | 1.0 | 1.5 |
| Other types of investor | 17.4 | 12.1 | 15.0 | 8.2 | 13.3 |
In the Toronto and Vancouver CMAs, investment properties were concentrated in the downtown core
In both Toronto and Vancouver CMAs, there was a higher proportion of investment properties in the core census subdivisions (CSDs). In the Vancouver CMA, the Greater Vancouver ANote CSD was the one exception, with a higher proportion of houses and condominium apartments used as an investment (42.1{d4d1dfc03659490934346f23c59135b993ced5bc8cc26281e129c43fe68630c9}) than in the other CSDs in the region. This is consistent with other trends observed for Greater Vancouver A. According to the 2021 Census, this CSD had a higher proportion of renters (57.3{d4d1dfc03659490934346f23c59135b993ced5bc8cc26281e129c43fe68630c9} of households) than in the rest of the CMA. This difference is partially due to the students who attend the University of British Columbia, which is located in this area. Students are more likely to be renters, but they could also be owners, or they could live in a second property owned by a family member. In addition, this CSD had the highest non-resident ownership rate (14.9{d4d1dfc03659490934346f23c59135b993ced5bc8cc26281e129c43fe68630c9}) in the CMA in 2020.
In the City of Vancouver, which is the core CSD, the proportion of houses and condominium apartments used as an investment was 32.5{d4d1dfc03659490934346f23c59135b993ced5bc8cc26281e129c43fe68630c9}, the second highest proportion in the Vancouver CMA, which had an overall rate of 21.3{d4d1dfc03659490934346f23c59135b993ced5bc8cc26281e129c43fe68630c9}. The higher share of investment properties in the core CSD is partly due to a greater concentration of condominium apartments, which are more often used as an investment. However, even considering condominium apartments and single detached houses separately, both had a higher rate of properties used as an investment in the Vancouver CSD than in the rest of the CMA.
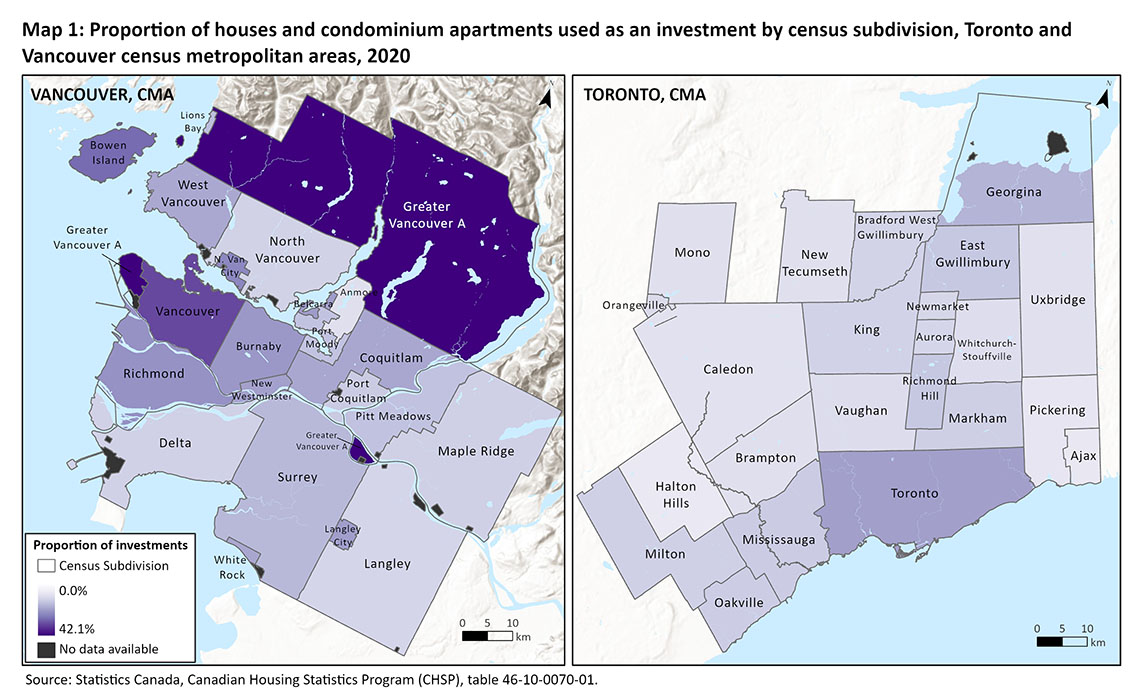
Description for Map 1
The title of the map is: “Proportion of houses and condominium apartments used as an investment by census subdivision, Toronto and Vancouver census metropolitan areas, 2020.” This figure displays two maps of the CSDs in the Vancouver CMA (left side) and the Toronto CMA (right side).
Each CSD is shaded from light to dark purple based on the proportion of houses and condominium apartments used as an investment. The darker the shade, the higher the proportion of houses and condominium apartments used as an investment in that CSD. The map shows that the proportion of houses and condominium apartments used as an investment is generally higher in CSDs near the core of the Vancouver and Toronto CMAs. A continuous scale is used and ranges from 0.0{d4d1dfc03659490934346f23c59135b993ced5bc8cc26281e129c43fe68630c9} to 42.1{d4d1dfc03659490934346f23c59135b993ced5bc8cc26281e129c43fe68630c9}.
| Census subdivision name | Proportion of houses and condominium apartments used as an investment (percent) |
|---|---|
| Toronto CMA | |
| Ajax, Town | 7.4 |
| Aurora, Town | 12.1 |
| Bradford West Gwillimbury, Town | 12.6 |
| Brampton, City | 9.8 |
| Caledon, Town | 9.2 |
| East Gwillimbury, Town | 15.1 |
| Georgina, Town | 18.4 |
| Halton Hills, Town | 7.1 |
| King, Township | 12.9 |
| Markham, City | 13.7 |
| Milton, Town | 13.2 |
| Mississauga, City | 14.2 |
| Mono, Town | 9.6 |
| New Tecumseth, Town | 9.8 |
| Newmarket, Town | 12.1 |
| Oakville, Town | 13.9 |
| Orangeville, Town | 11.5 |
| Pickering, City | 8.0 |
| Richmond Hill, Town | 15.0 |
| Toronto, City | 21.7 |
| Uxbridge, Township | 9.5 |
| Vaughan, City | 10.6 |
| Whitchurch-Stouffville, Town | 10.2 |
| Vancouver | |
| Anmore, Village | 9.2 |
| Belcarra, Village | 20.9 |
| Bowen Island, Island municipality | 28.3 |
| Burnaby, City | 21.6 |
| Coquitlam, City | 19.1 |
| Delta, District municipality | 12.1 |
| Greater Vancouver A, Regional district electoral area | 42.1 |
| Langley, City | 20.6 |
| Langley, District municipality | 11.4 |
| Lions Bay, Village | 16.0 |
| Maple Ridge, City | 12.3 |
| New Westminster, City | 20.2 |
| North Vancouver, City | 24.3 |
| North Vancouver, District municipality | 11.8 |
| Pitt Meadows, City | 14.8 |
| Port Coquitlam, City | 13.3 |
| Port Moody, City | 14.8 |
| Richmond, City | 22.4 |
| Surrey, City | 16.5 |
| Vancouver, City | 32.5 |
| West Vancouver, District municipality | 19.0 |
| White Rock, City | 19.2 |
The finding was similar in Toronto, where the proportion of investment properties was higher in the core CSD of the City of Toronto (21.7{d4d1dfc03659490934346f23c59135b993ced5bc8cc26281e129c43fe68630c9}) than in the CMA as a whole (16.3{d4d1dfc03659490934346f23c59135b993ced5bc8cc26281e129c43fe68630c9}). For the CSD, this amounts to 112,220 condominium apartments and 52,935 houses used as an investment.
Note to readers
The Canadian Housing Statistics Program (CHSP) is an innovative data project that leverages existing data sources and transforms them into new and timely indicators on Canadian housing.
The data in this study are compiled from the CHSP for the reference year 2020. Complete information about the reference years of the property stock, by province and territory, are available here.
Methodology
Investor status and investment status of the residential property take into consideration the type of property as obtained by our data providers. Certain properties may have secondary units that are not known to the authorities. As a result, we cannot account for them. The counts and distribution of properties are calculated based on the property classifications established by the CHSP. These may differ from the ones used by local authorities.
Once the property is categorized as an investment property, a subcategory is created to determine the type of investment property. This is based on the type of investor who owns it. The order of priority is as follows:
- Investment property owned by at least one business or one government;
- Investment property owned by at least one non-resident individual;
- Investment property owned by at least one out-of-province individual;
- Investment property owned by an individual living in the province.
Properties cannot be included in more than one investment property category. If the property has multiple owners with various profiles, once an owner fits in one of the categories, by order of priority, then the property is included in that category.
Geographical boundaries
In CHSP releases, data are based on the geographical boundaries from the Standard Geographical Classification 2016.
The CHSP database does not contain information about residential properties on Indian reserves.
Definitions
A property owner refers to an individual or an entity included in the classification of ‘business and government’ (such as corporations, governments, sole proprietorships and partnerships, and other legal types) that has property title transferred to, recorded in, registered in, or otherwise carried in their name.
A property may have more than one owner or an owner may have more than one property, therefore the count of owners and properties can differ.
An individual is considered a non-resident if their primary dwelling is outside the economic territory of Canada.
The core of a geographic area, for the purposes of this release, refers to the census subdivision (CSD) within a census metropolitan area (CMA) with the highest number of residential properties.
An investor is defined as an owner who owns at least one residential property that is not used as their primary place of residence, excluding Canadian non-profit organizations. An individual owner who owns a single property in the same province as where they reside is not considered an investor, so long as it is not a property with multiple residential units. This category excludes investor-occupants.
An investor-occupant is defined as an owner who possesses a single property with multiple residential units and who occupies that property.
A non-investor is defined as an owner who is not an investor or an investor-occupant. An owner who lives in the same province as where the property is owned and owns a single property is included in this category, so long as it is not a property with multiple residential units.
An investment property refers to a residential property owned by at least one investor and is not used as a primary place of residence by any of the owners. This category excludes owner-occupied investment properties.
An owner-occupied investment property refers to a property with multiple residential units where at least one of the owners occupies a unit.
A non-investment property refers to a property held solely by non-investors or a property being used as a primary place of residence by at least one of the owners and that is not an owner-occupied investment property.
The term unspecified investment property status refers to properties whose owner is unknown, and therefore the investment status of the property cannot be determined.
A property with multiple residential units refers to a property containing more than one set of living quarters owned by the same owner(s), as is the case for an apartment building or a duplex or a property with two houses on the same lot.
A condominium apartment refers to a set of living quarters that is owned individually, while land and common elements are held in joint ownership with others.
Bibliography
Allen, Marcus T., Rutherford, J., Rutherford, R., Yavas, A. (2018). Impact of Investors in Distressed Housing Markets. The Journal of Real Estate Finance and Economics. 56. 622-652.
Canada Mortgage and Housing Corporation (2016). “Condominium owners report – Toronto and Vancouver”. April 2016. https://publications.gc.ca/collections/collection_2016/schl-cmhc/NH21-3-2016-eng.pdf
Haughwout, A., D. Lee, J. Tracy, and van der Klaauw, W. (2011). Real estate investors, the leverage cycle, and the housing market crisis. Staff Reports 514, Federal Reserve Bank of New York.
Khan, M., Xu, Y. (2022). Housing demand in Canada: A novel approach to classifying mortgaged homebuyers. Staff Analytical Note 2022-1, Bank of Canada.
Statistics Canada. (2021). “Canadian Housing Statistics Program, 2020.” The Daily. September 17, Statistics Canada Catalogue no. 11-001-X. https://www150.statcan.gc.ca/n1/daily-quotidien/210917/dq210917b-eng.htm
Statistics Canada. (2022). “To buy or to rent: The housing market continues to be reshaped by several factors as Canadians search for an affordable place to call home.” The Daily. September 21. Statistics Canada Catalogue no. 11-001-X. https://www150.statcan.gc.ca/n1/daily-quotidien/220921/dq220921b-eng.htm
Statistic Canada. (2022). “Canadian Housing Statistics Program, 2019 and 2020.” The daily. November 11. Statistics Canada no.11-001-X. https://www150.statcan.gc.ca/n1/daily-quotidien/221110/dq221110c-eng.htm
Statistics Canada. (2022). Census Profile, 2021 Census. Statistics Canada Catalogue no. 98-316-X2021001. Last updated on September 21, 2022. https://www12.statcan.gc.ca/census-recensement/2021/dp-pd/prof/index.cfm?Lang=E
Teranet. (2022). Market Insight – The Canadian Source for Housing Information – Q2 2022, https://www.teranet.ca/wp-content/uploads/2022/06/Teranet-Market-Insight-Quarterly-Report-Q2-2022.pdf (accessed September 12, 2022).